Graph Maker
Create a custom chart or diagram in minutes. Transform data into beautiful visuals and powerful insights with Canva's online graph maker.
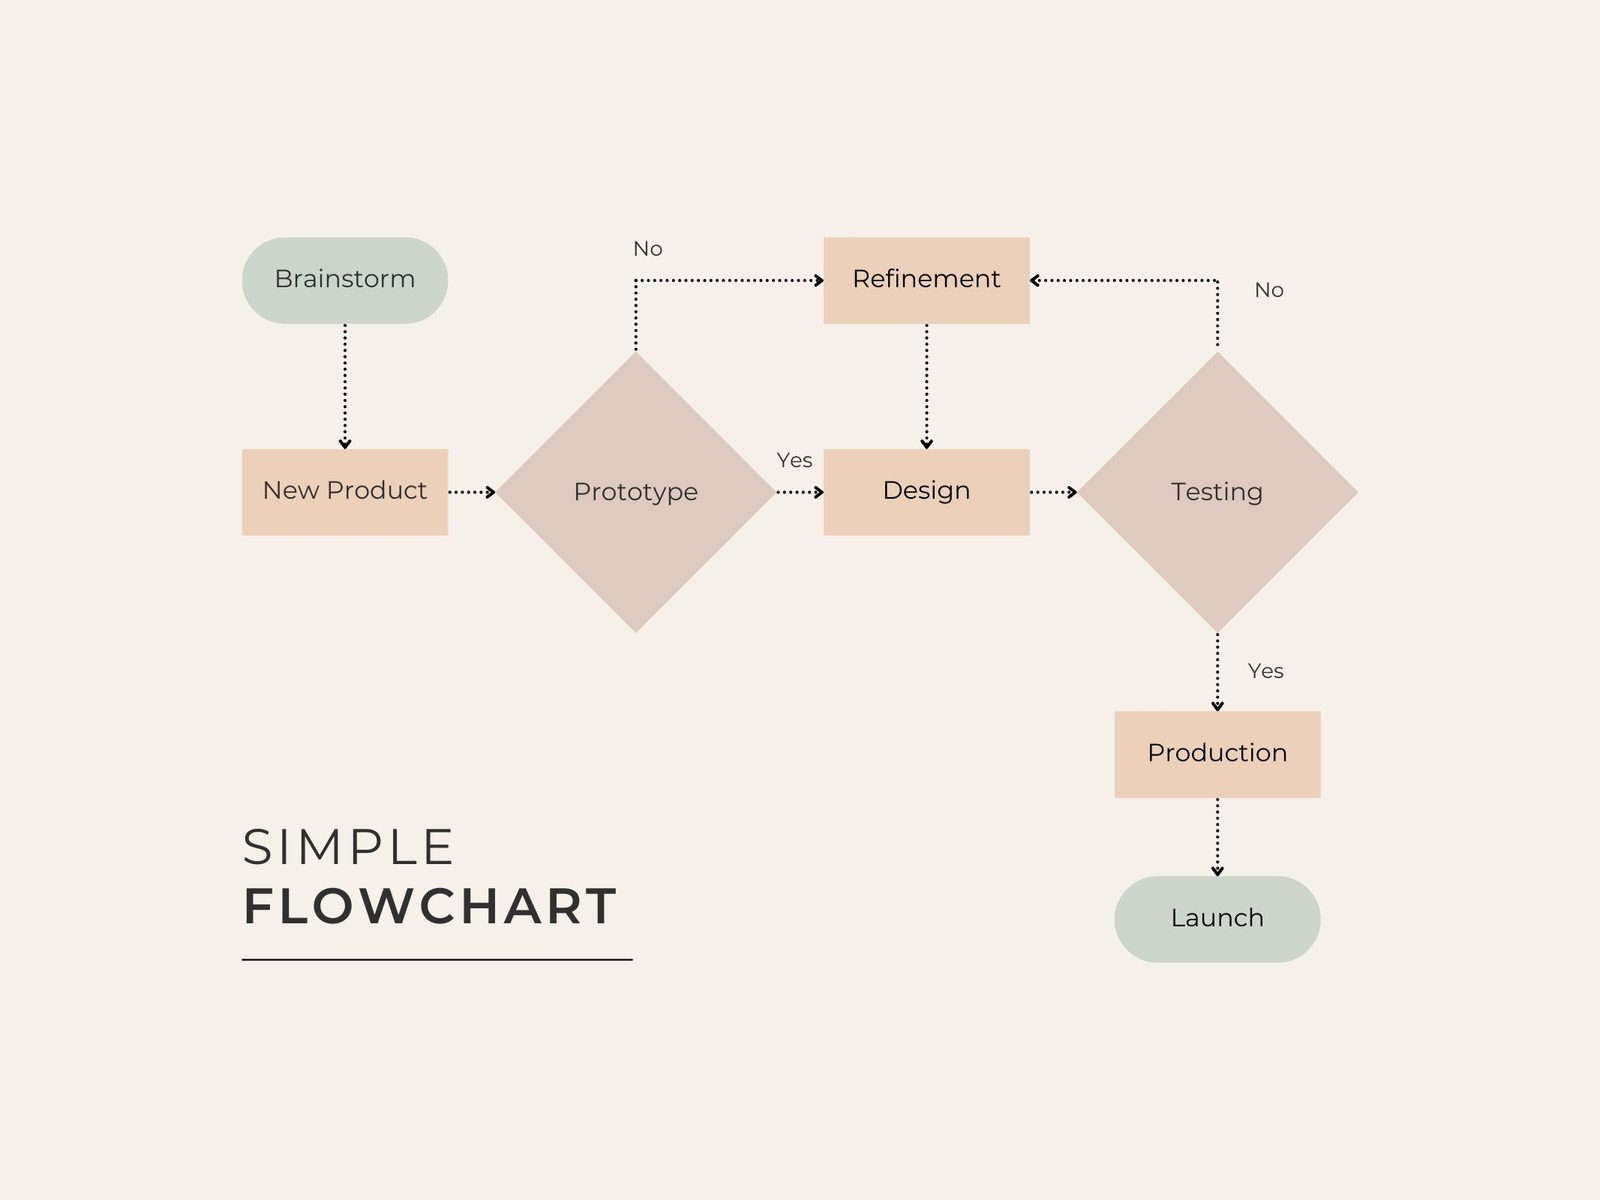
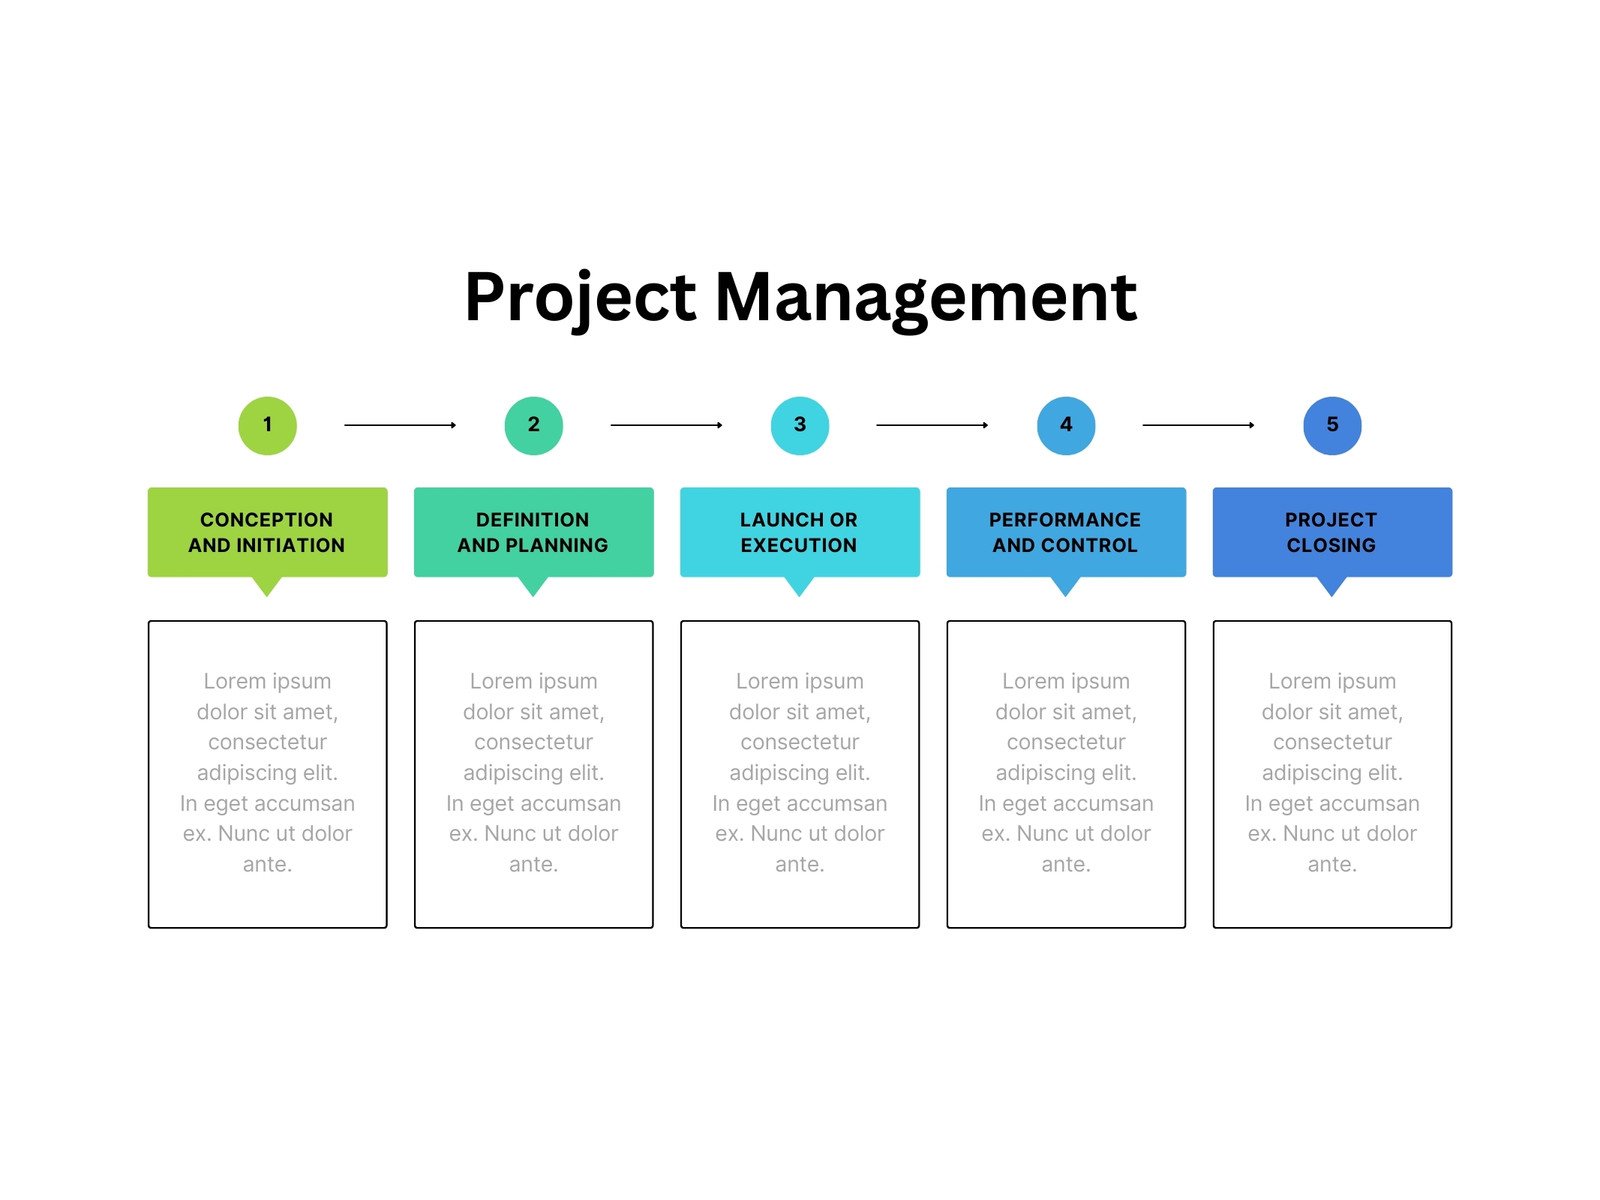
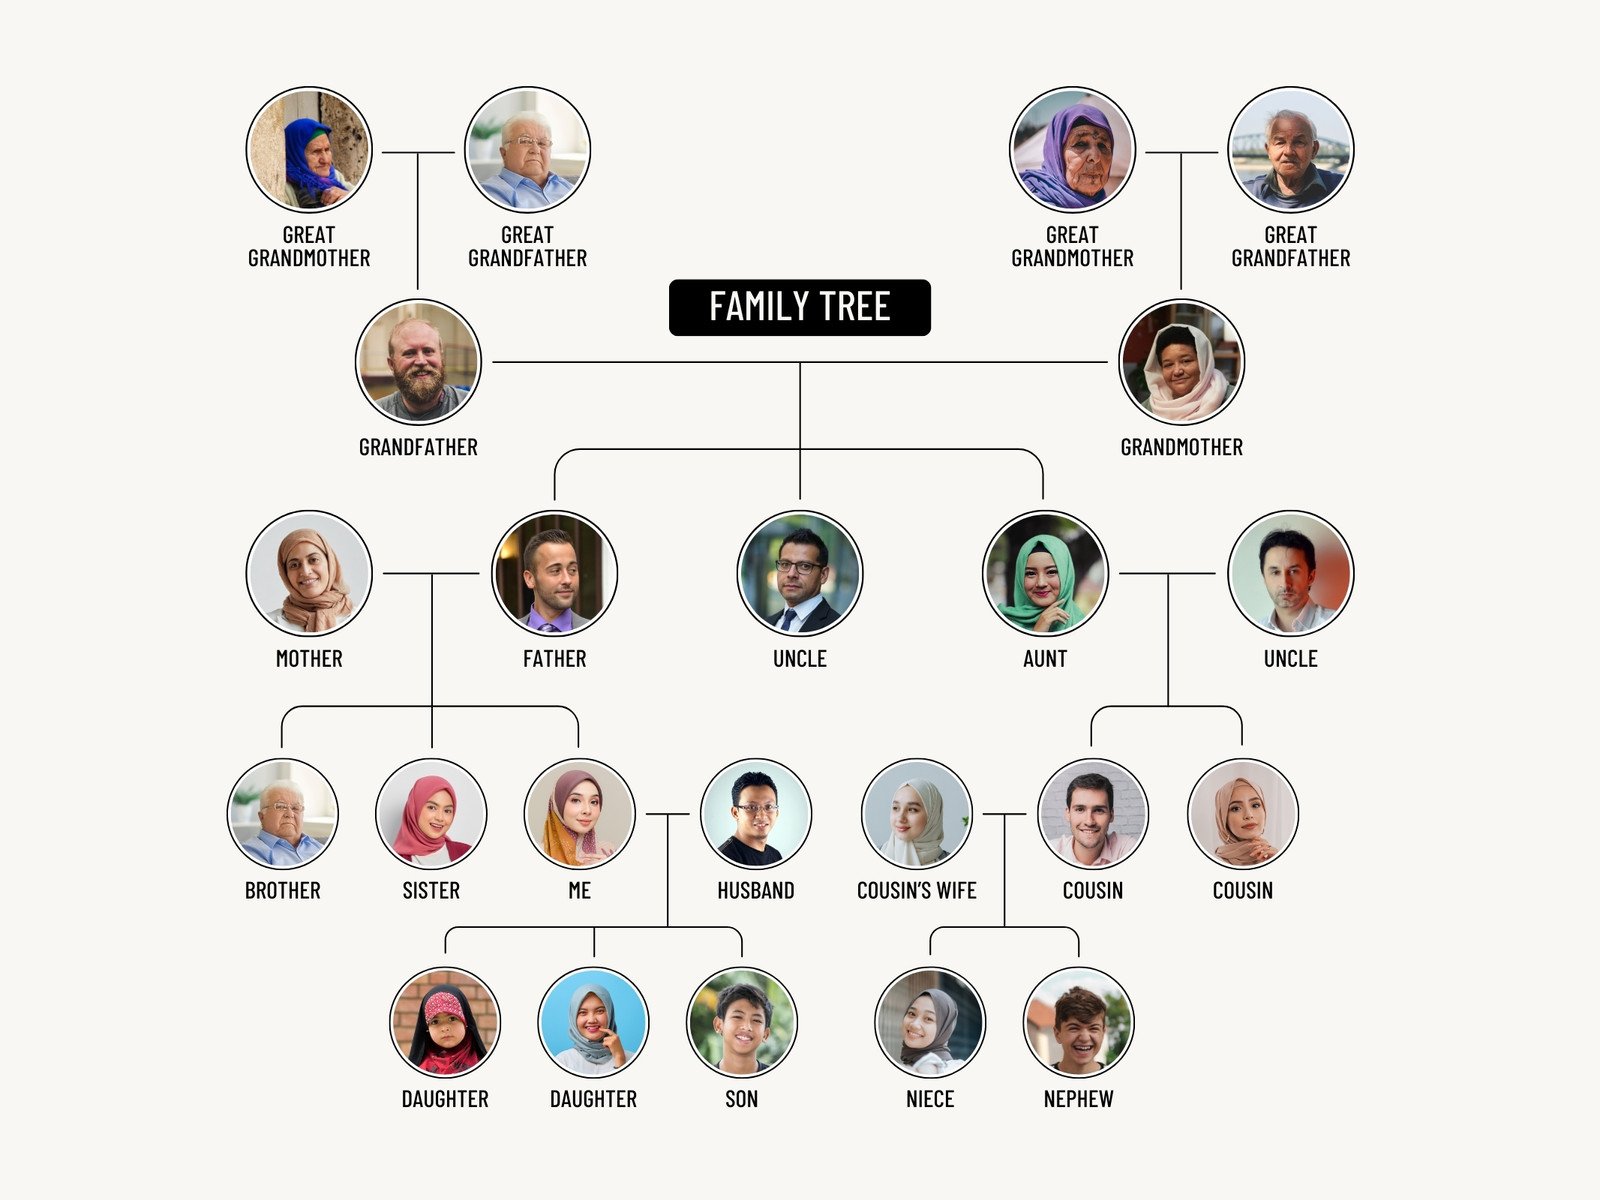
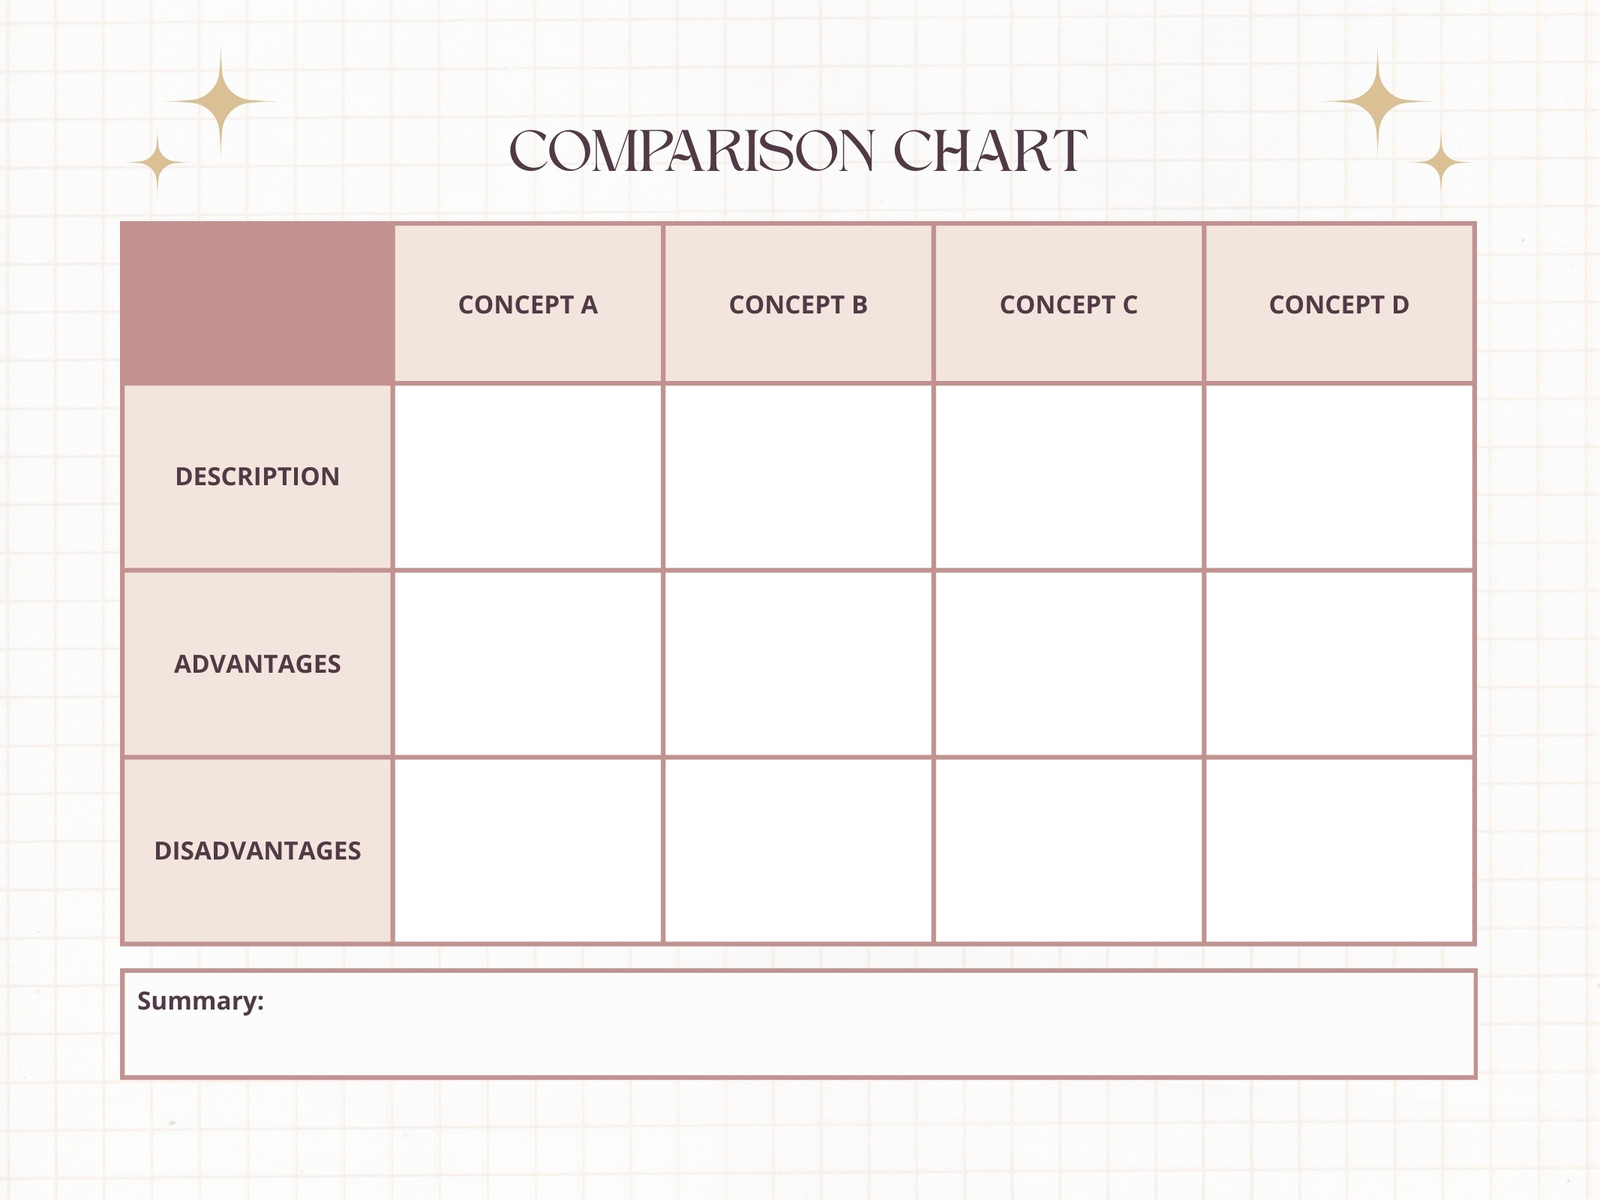
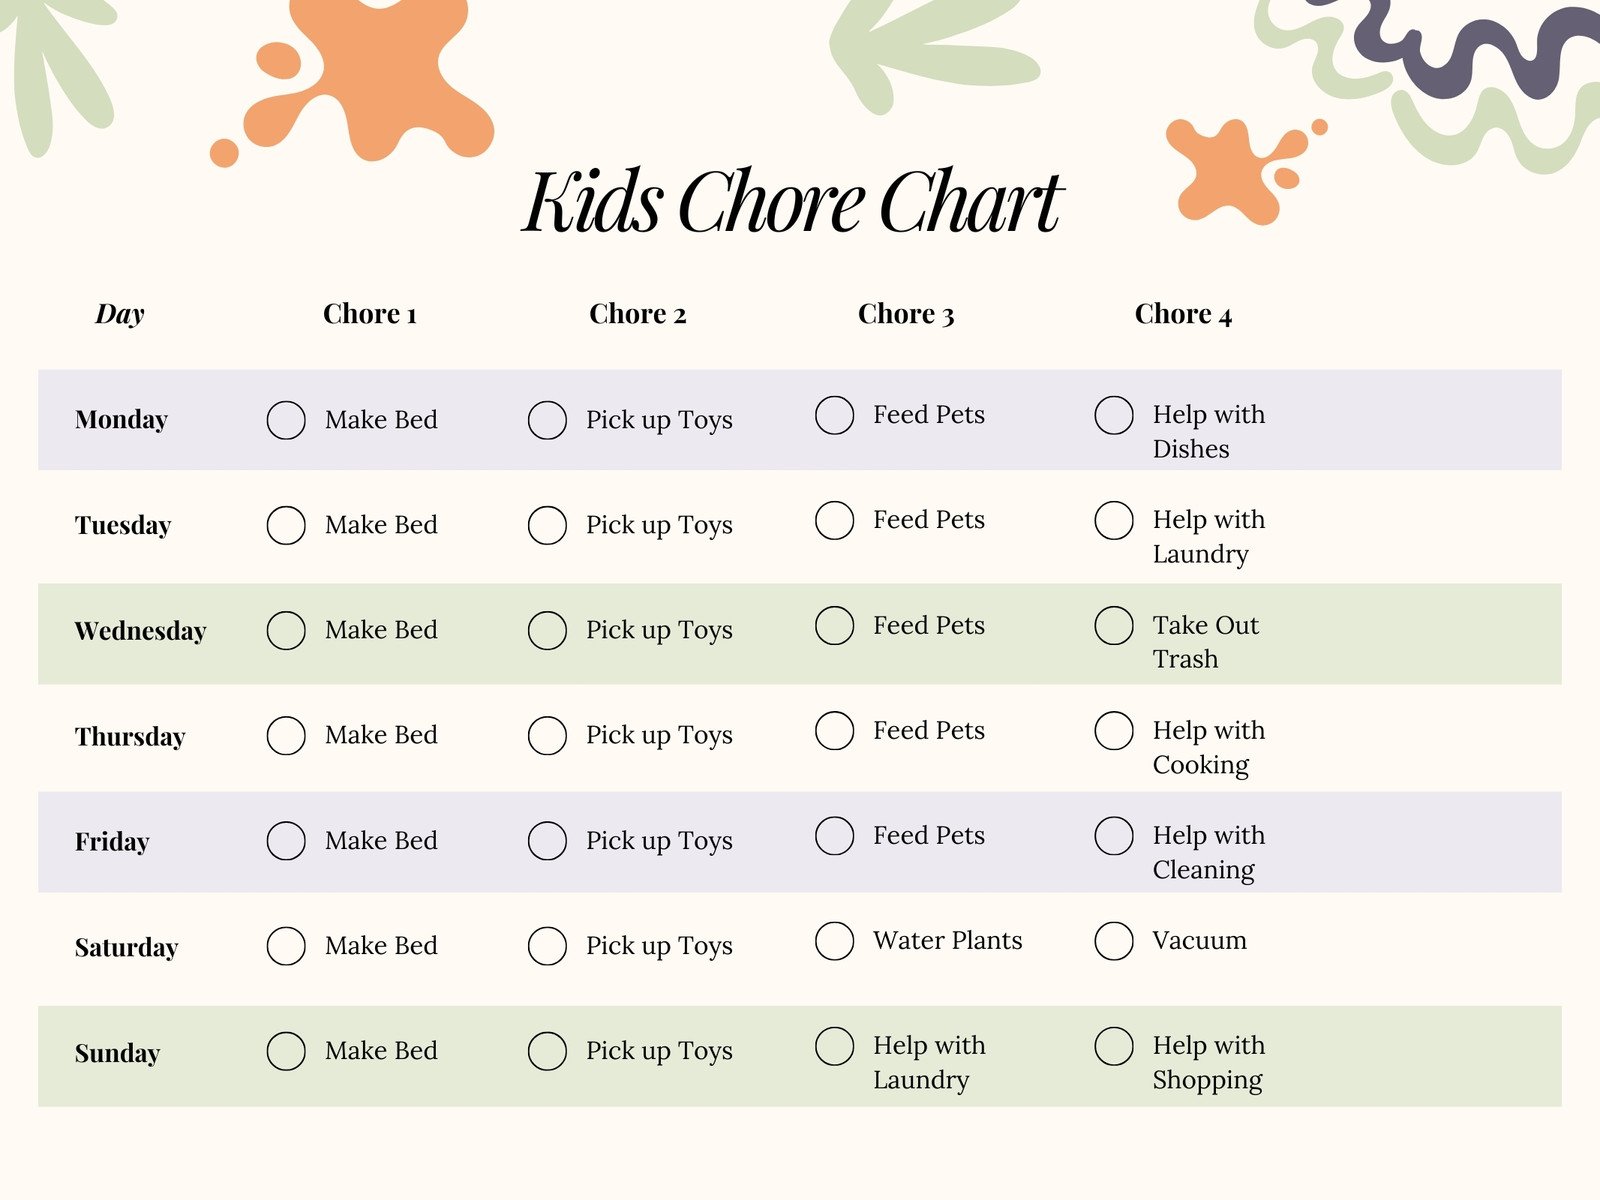
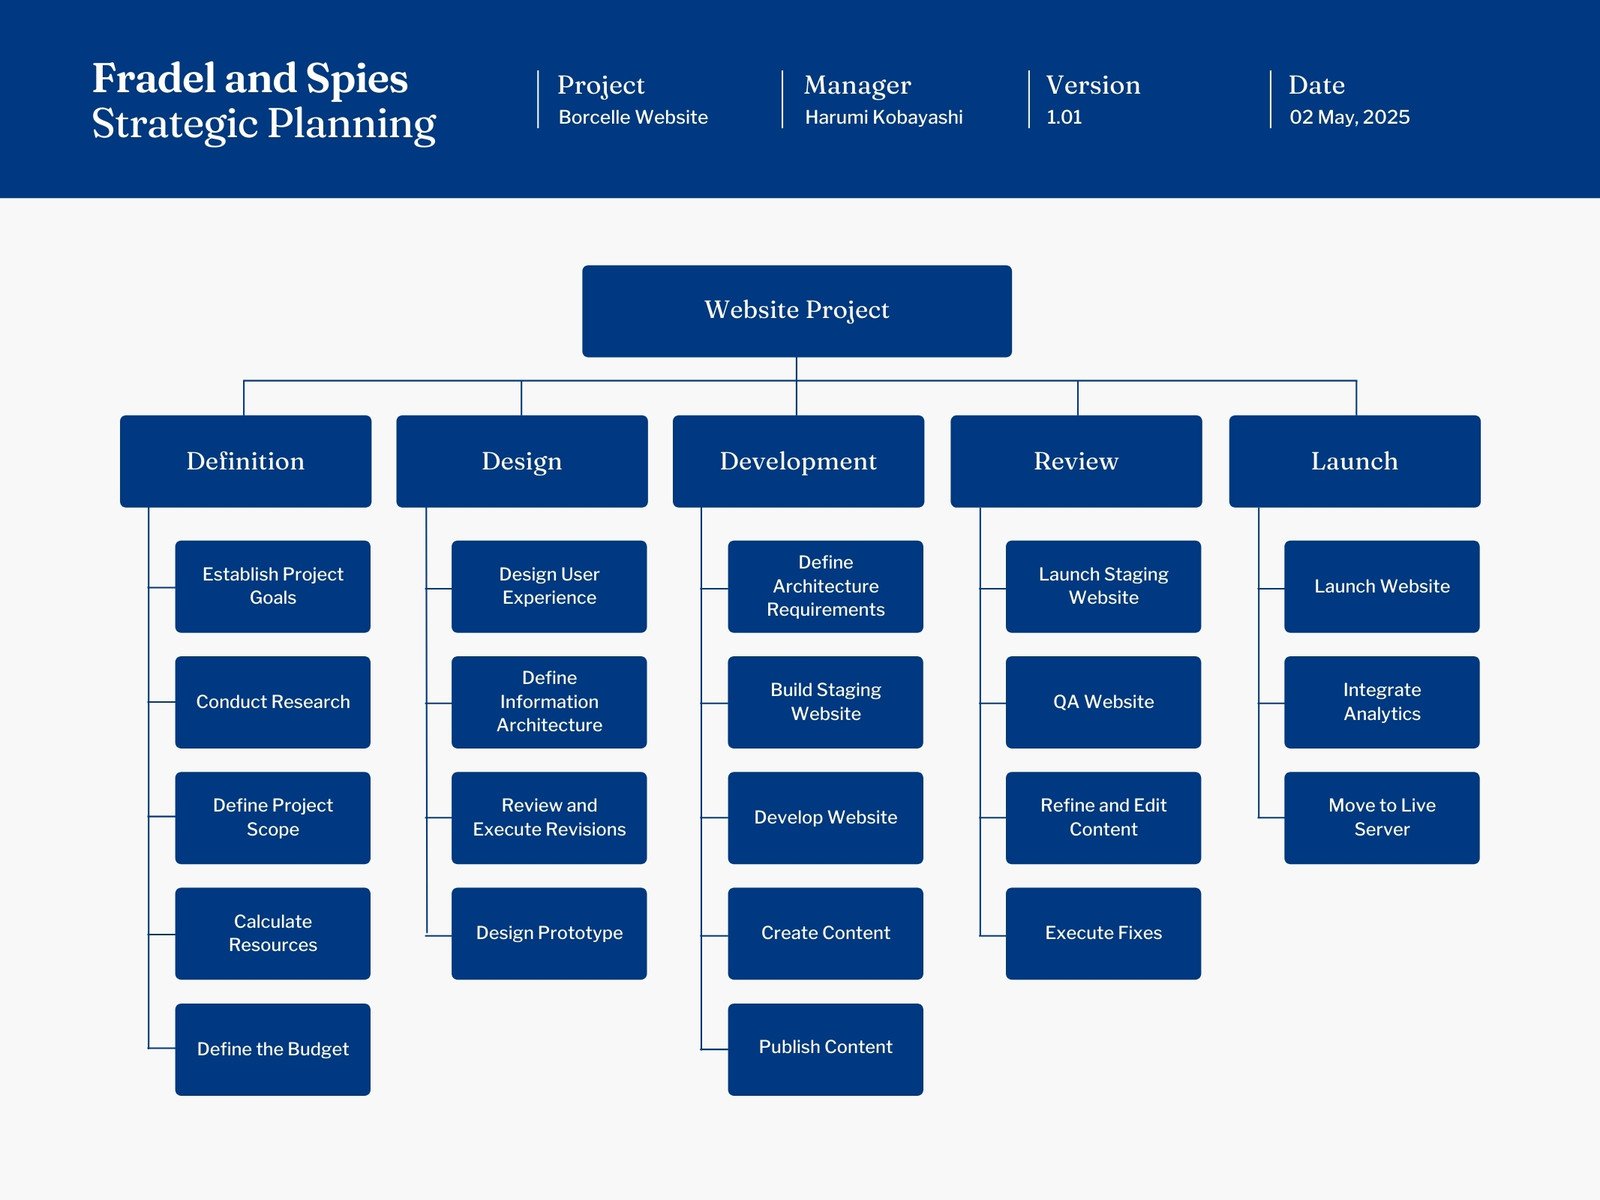
Browse our library of graphs
Discover the right type of graph for your project and showcase your insights with engaging, interactive charts.
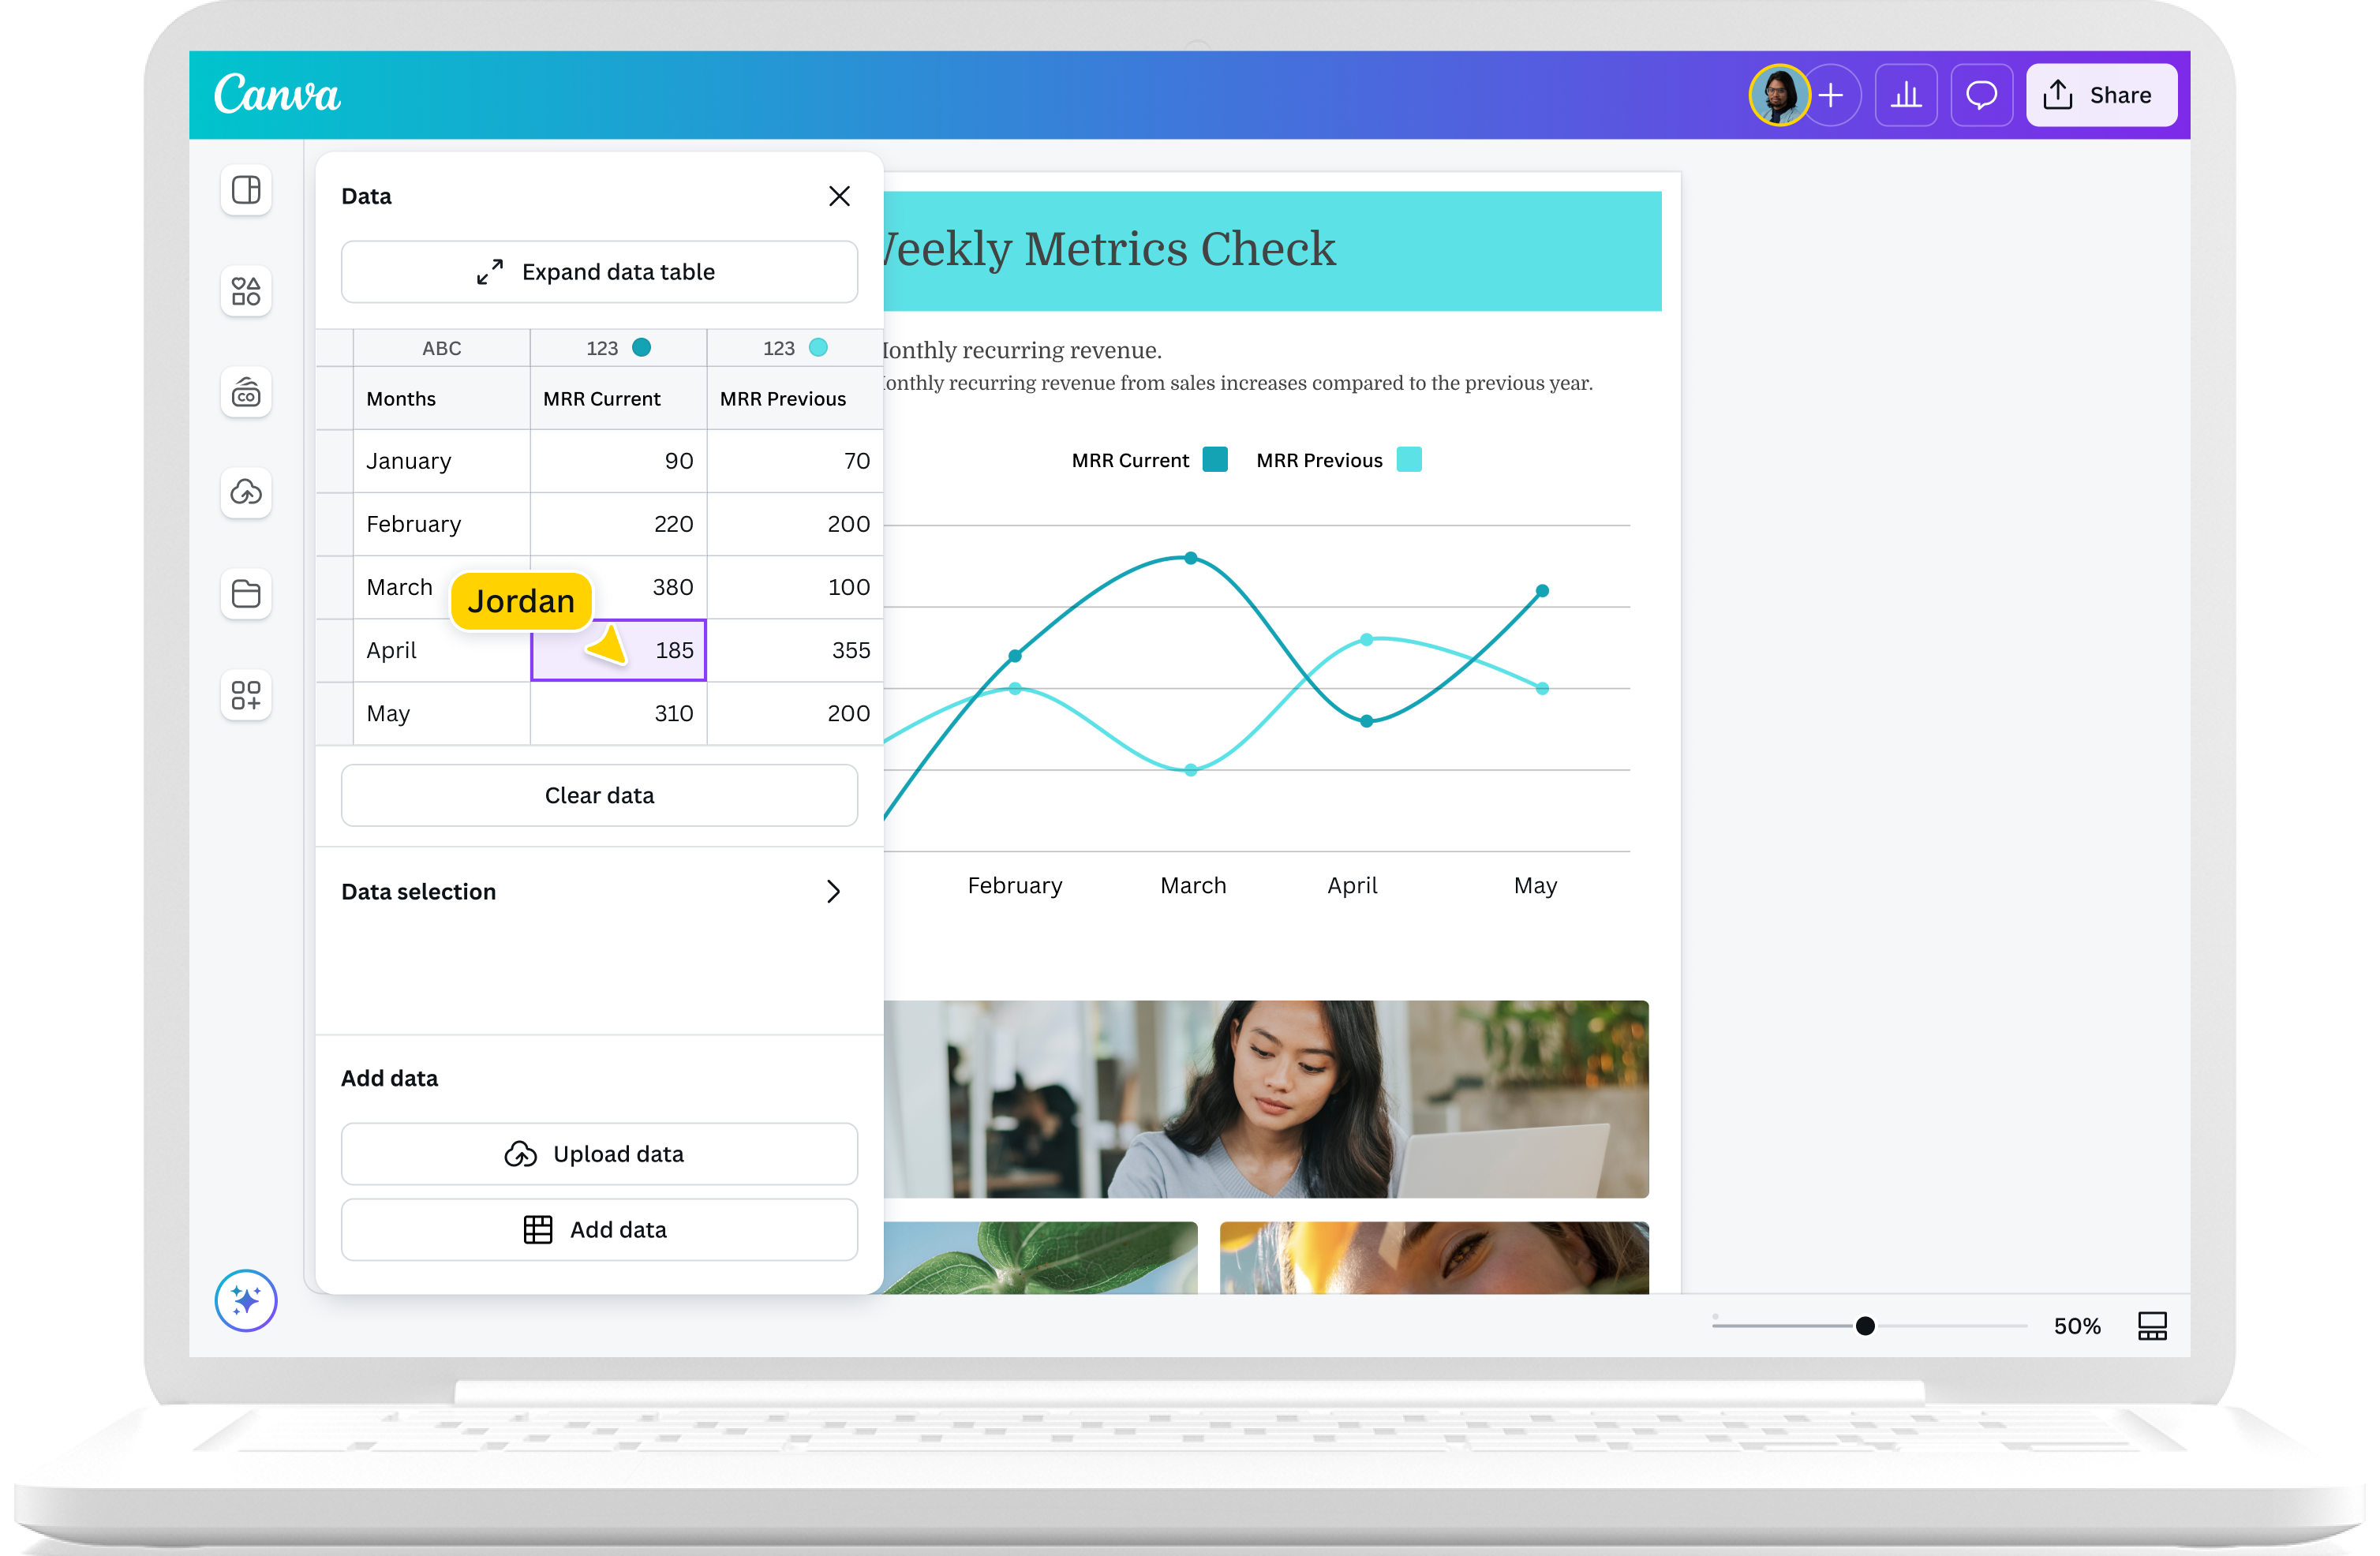
Data visualization made easy

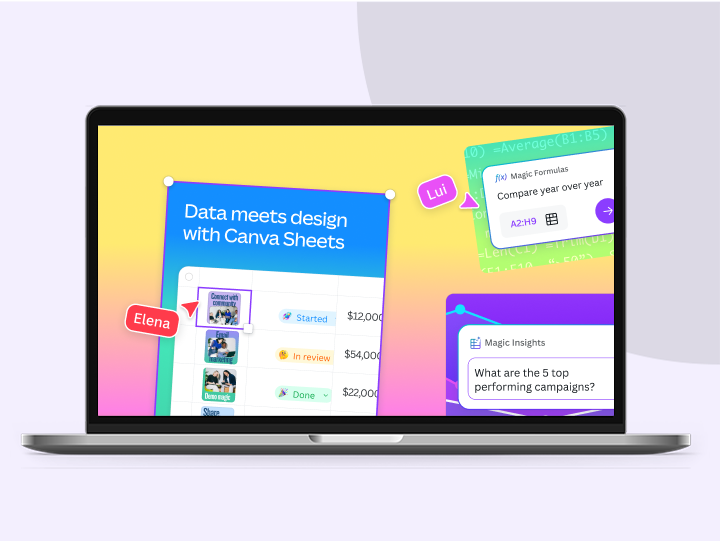
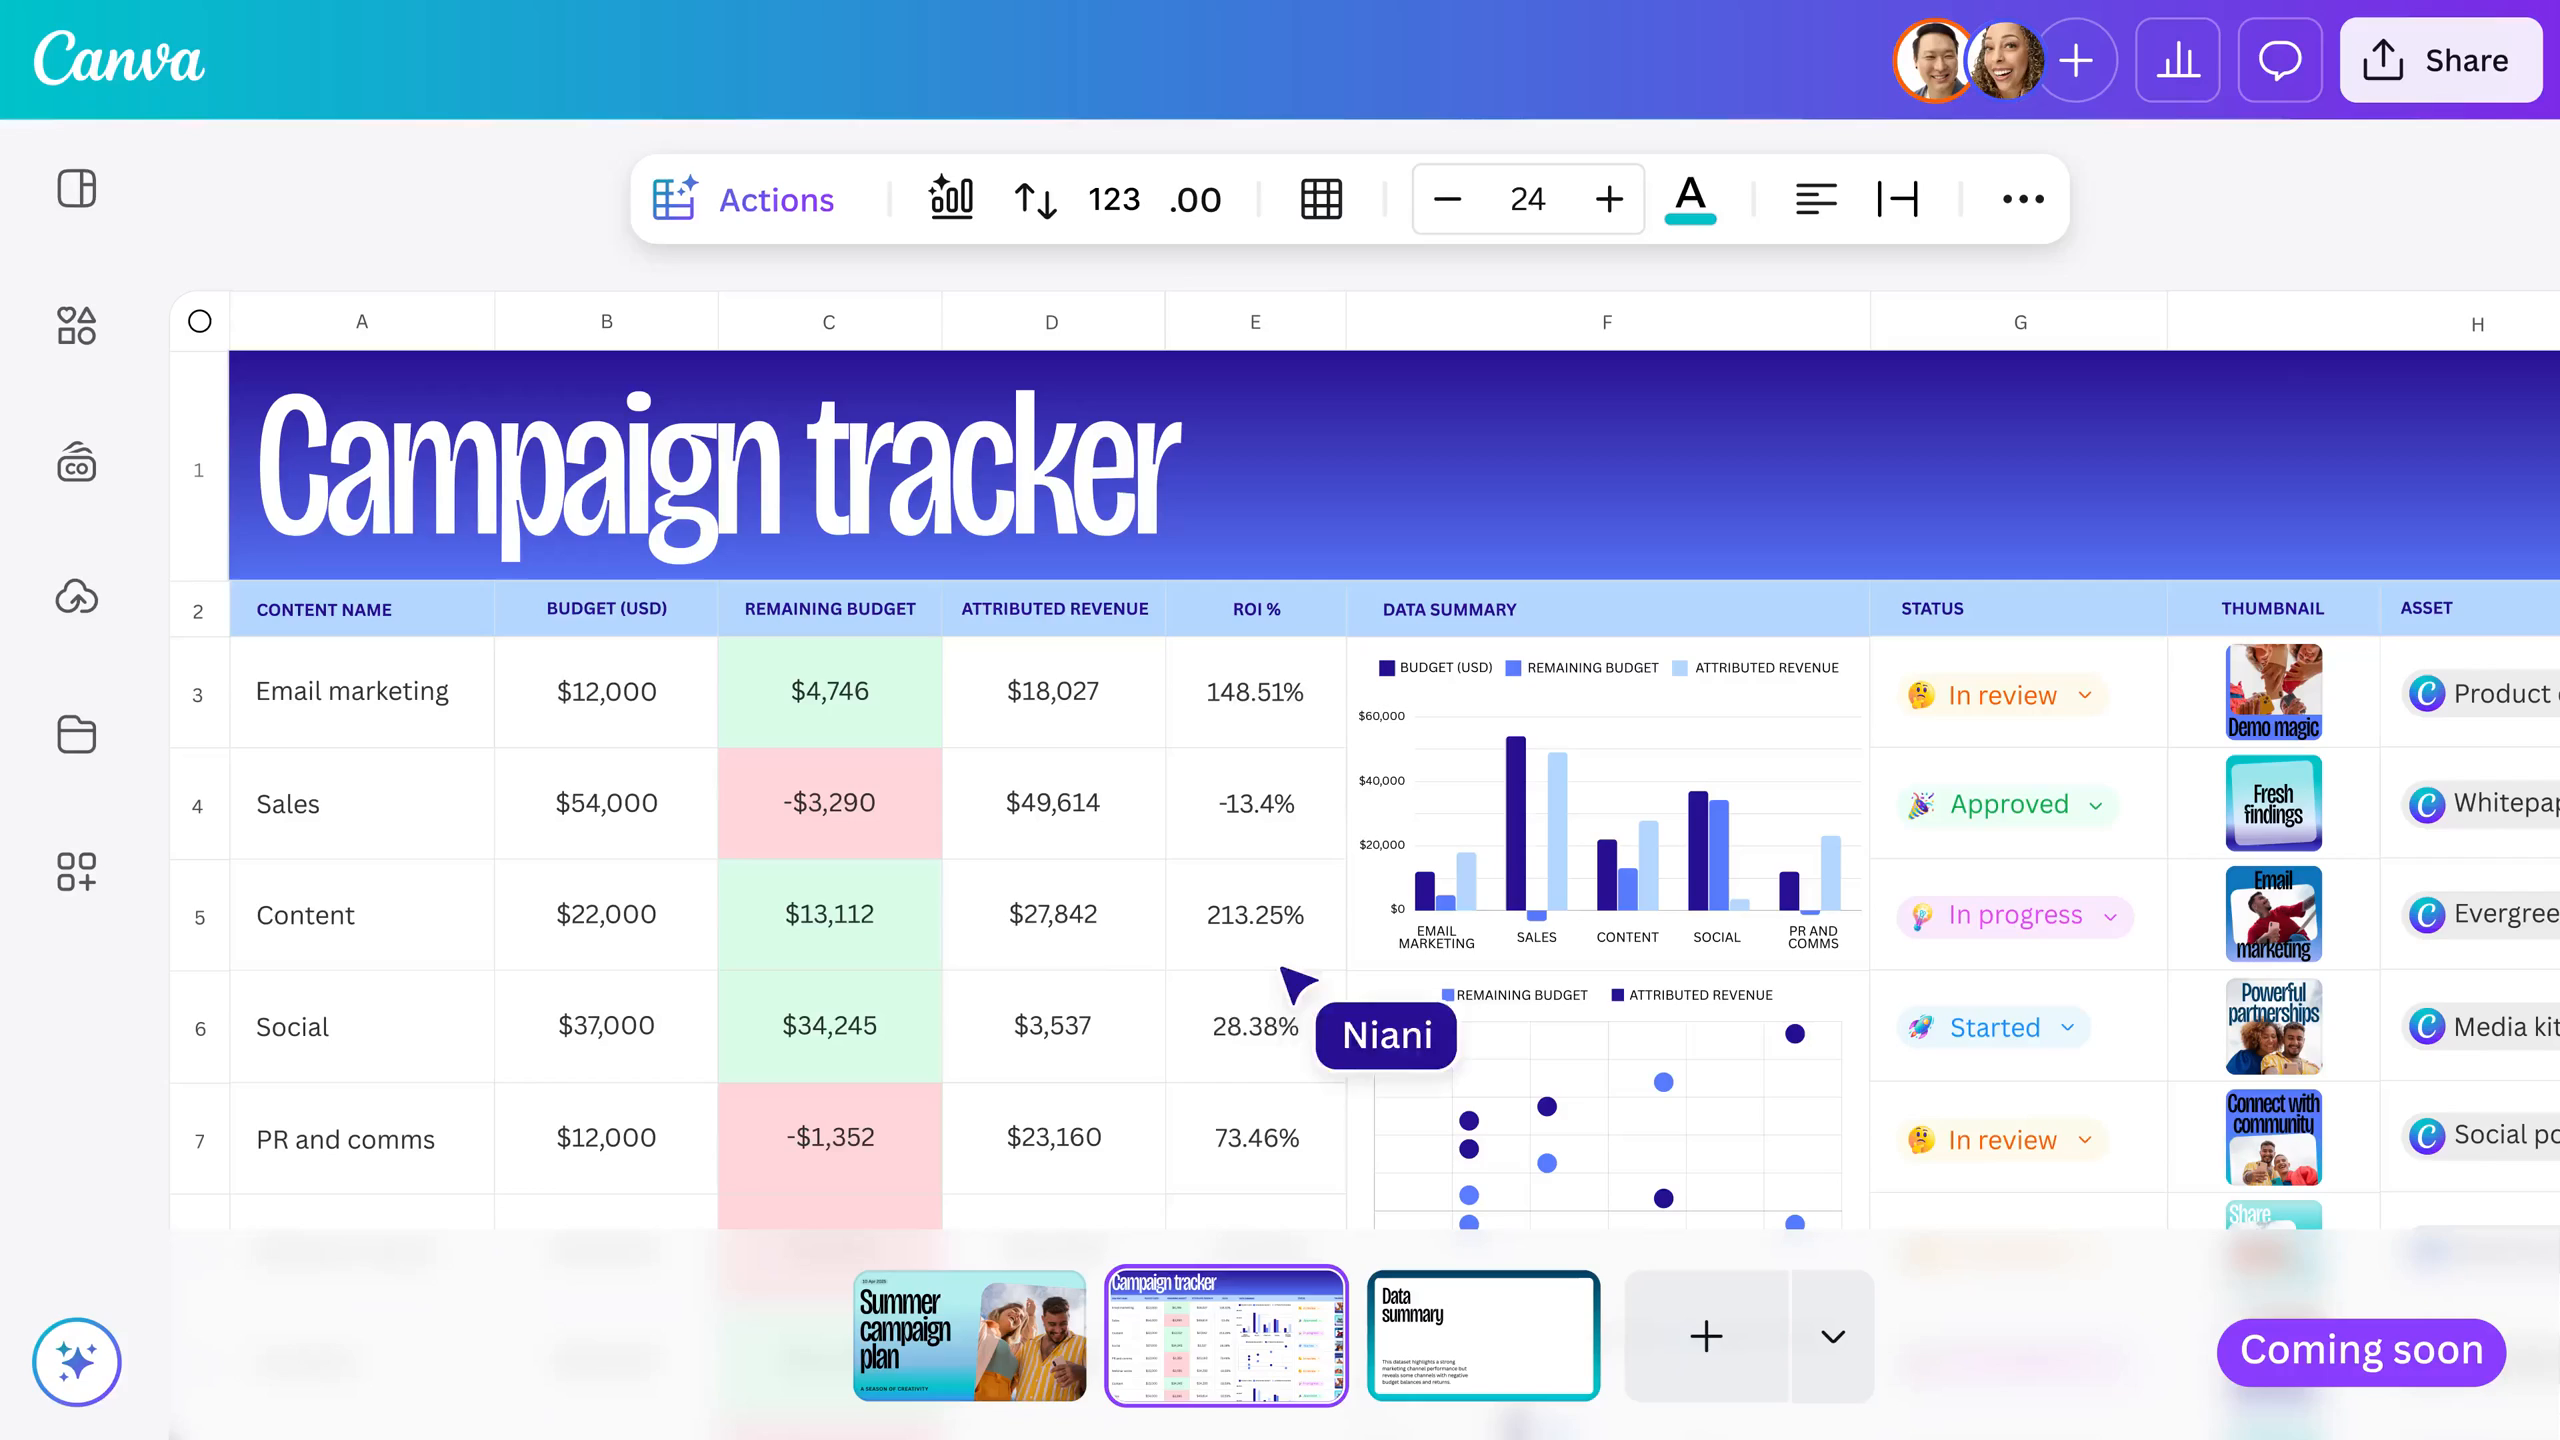
Magic Charts
Transform data into visuals that engage, captivate, and inform in an instant with Canva’s online graph maker. Need some inspiration? Let Magic Charts choose the best chart for your project and embed these directly into your designs.

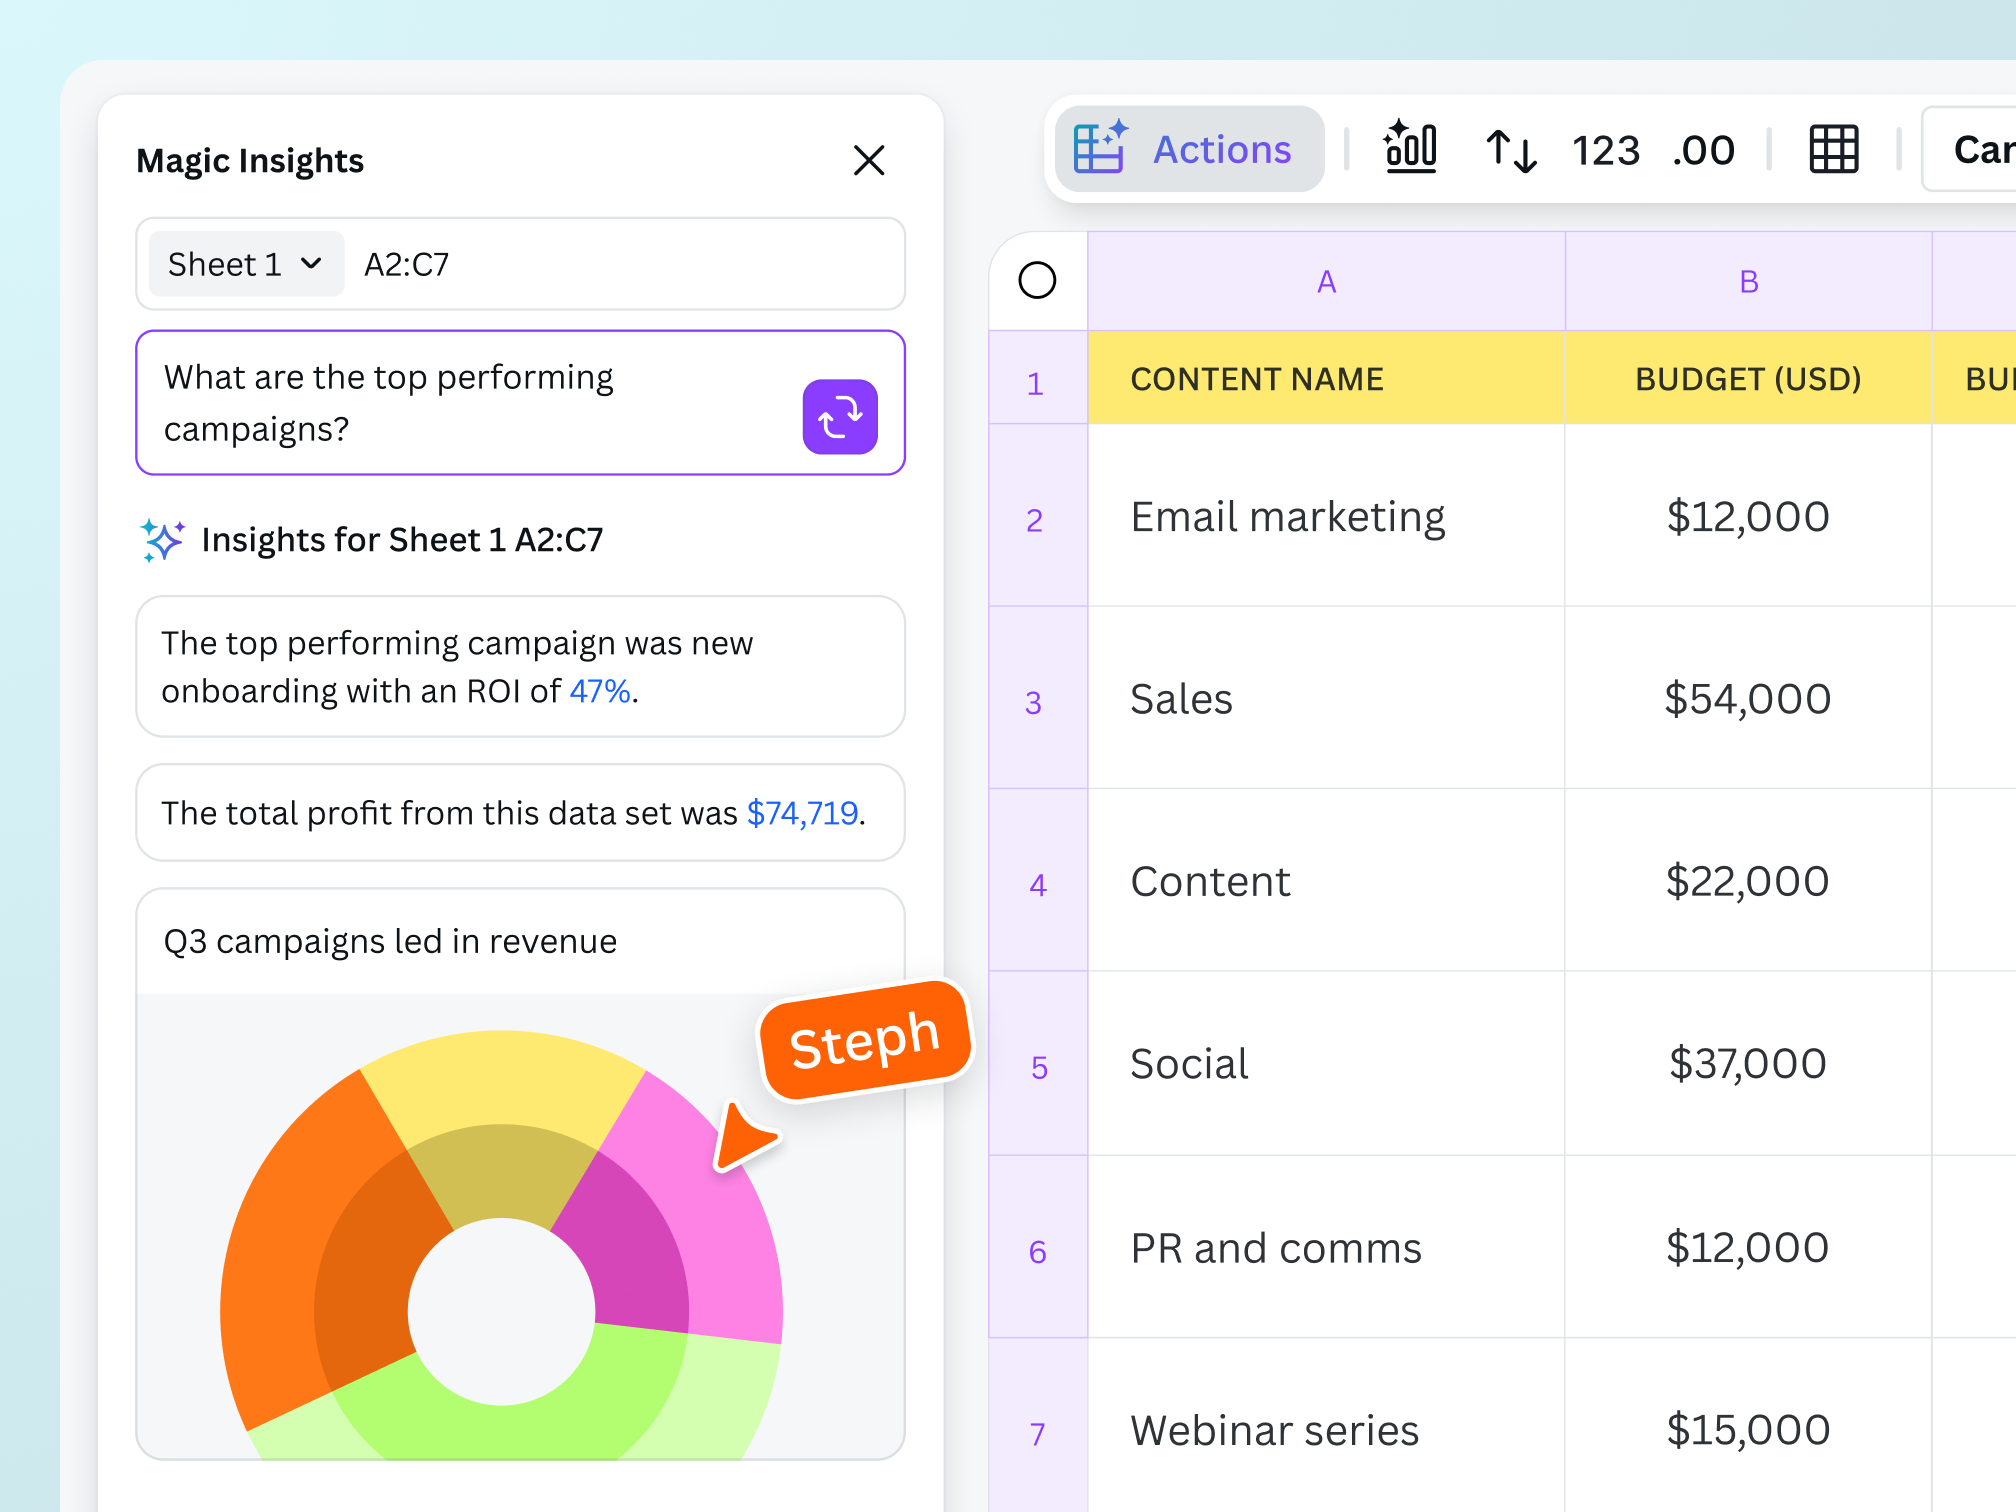
Magic Insights
Our AI data analysis tool uncovers patterns, trends, and key takeaways, transforming data into clear, compelling visuals and summaries. And with just a click, you can add your data story to any Canva design, giving anything — from presentations to social posts — a data-driven edge.

Engage with interactivity
Dynamic stories are now yours to tell. Guide your readers through your story with stunning, interactive visuals using our Match and Move animation button, or by using Scrollable Designs that reveal insights one by one (for Docs only).

Custom graphs to bring your data to life

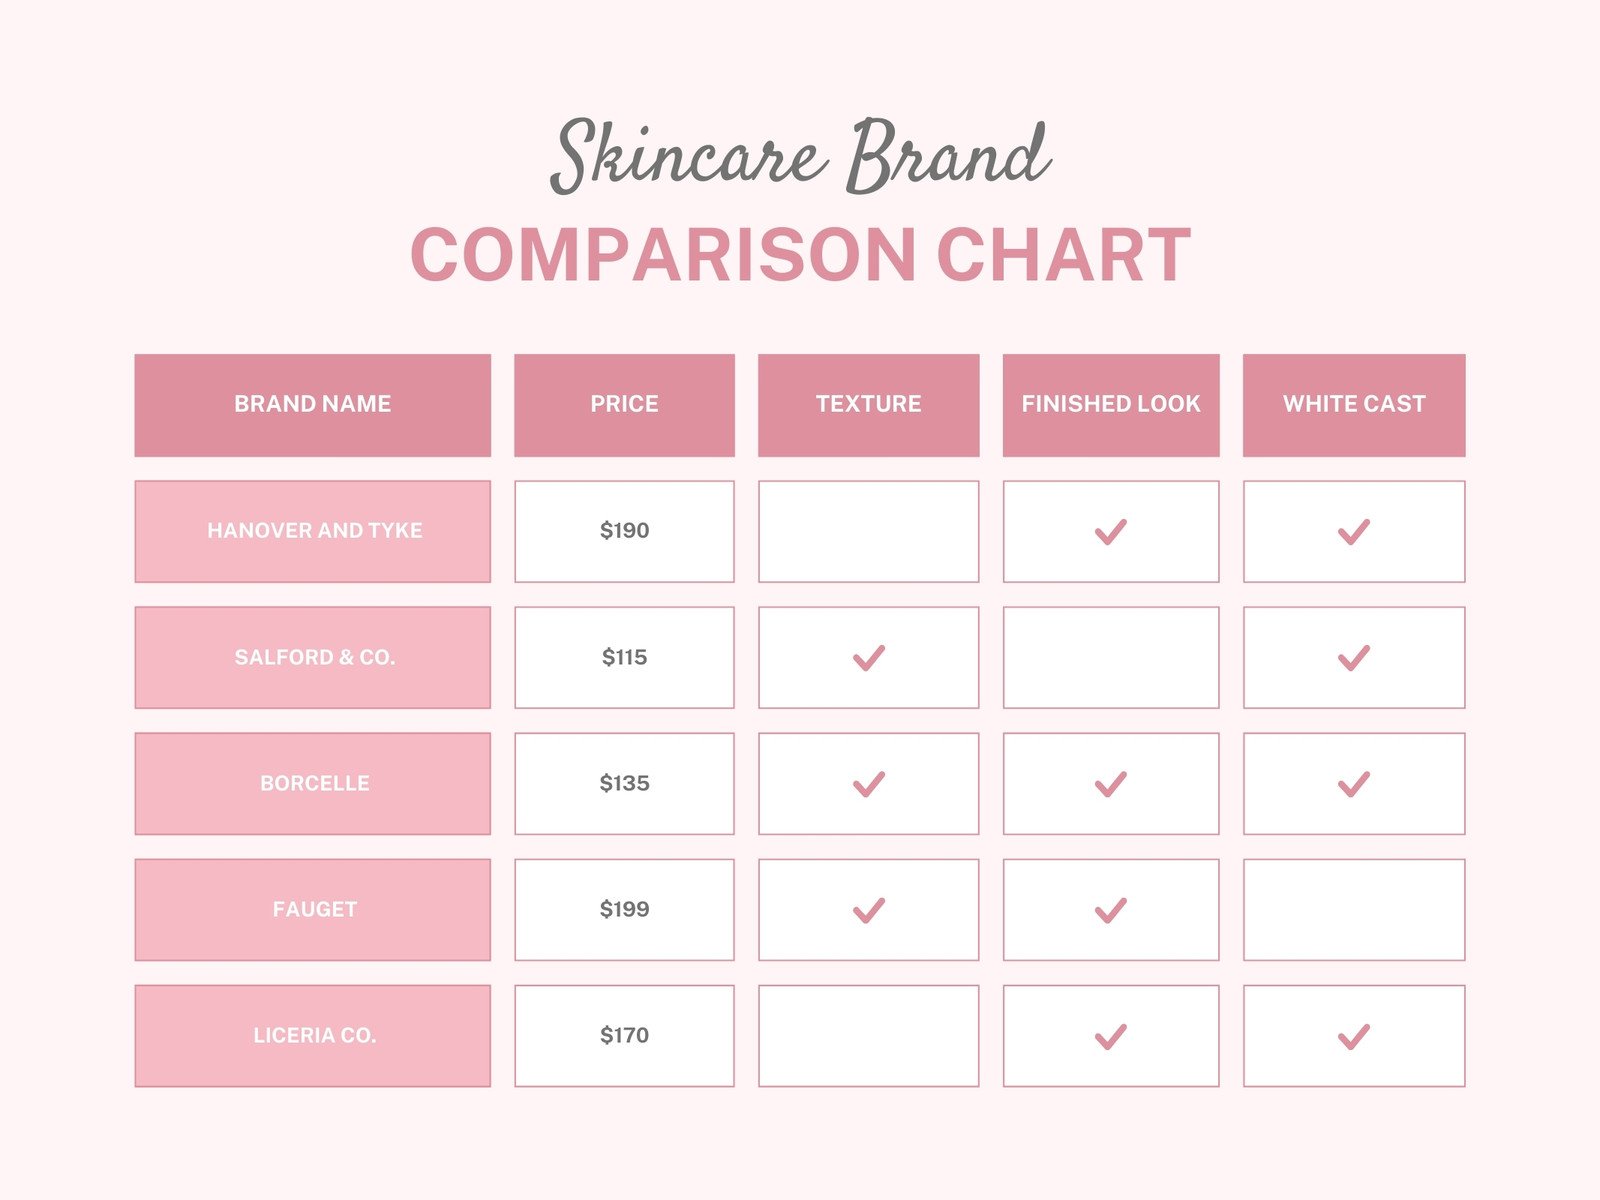
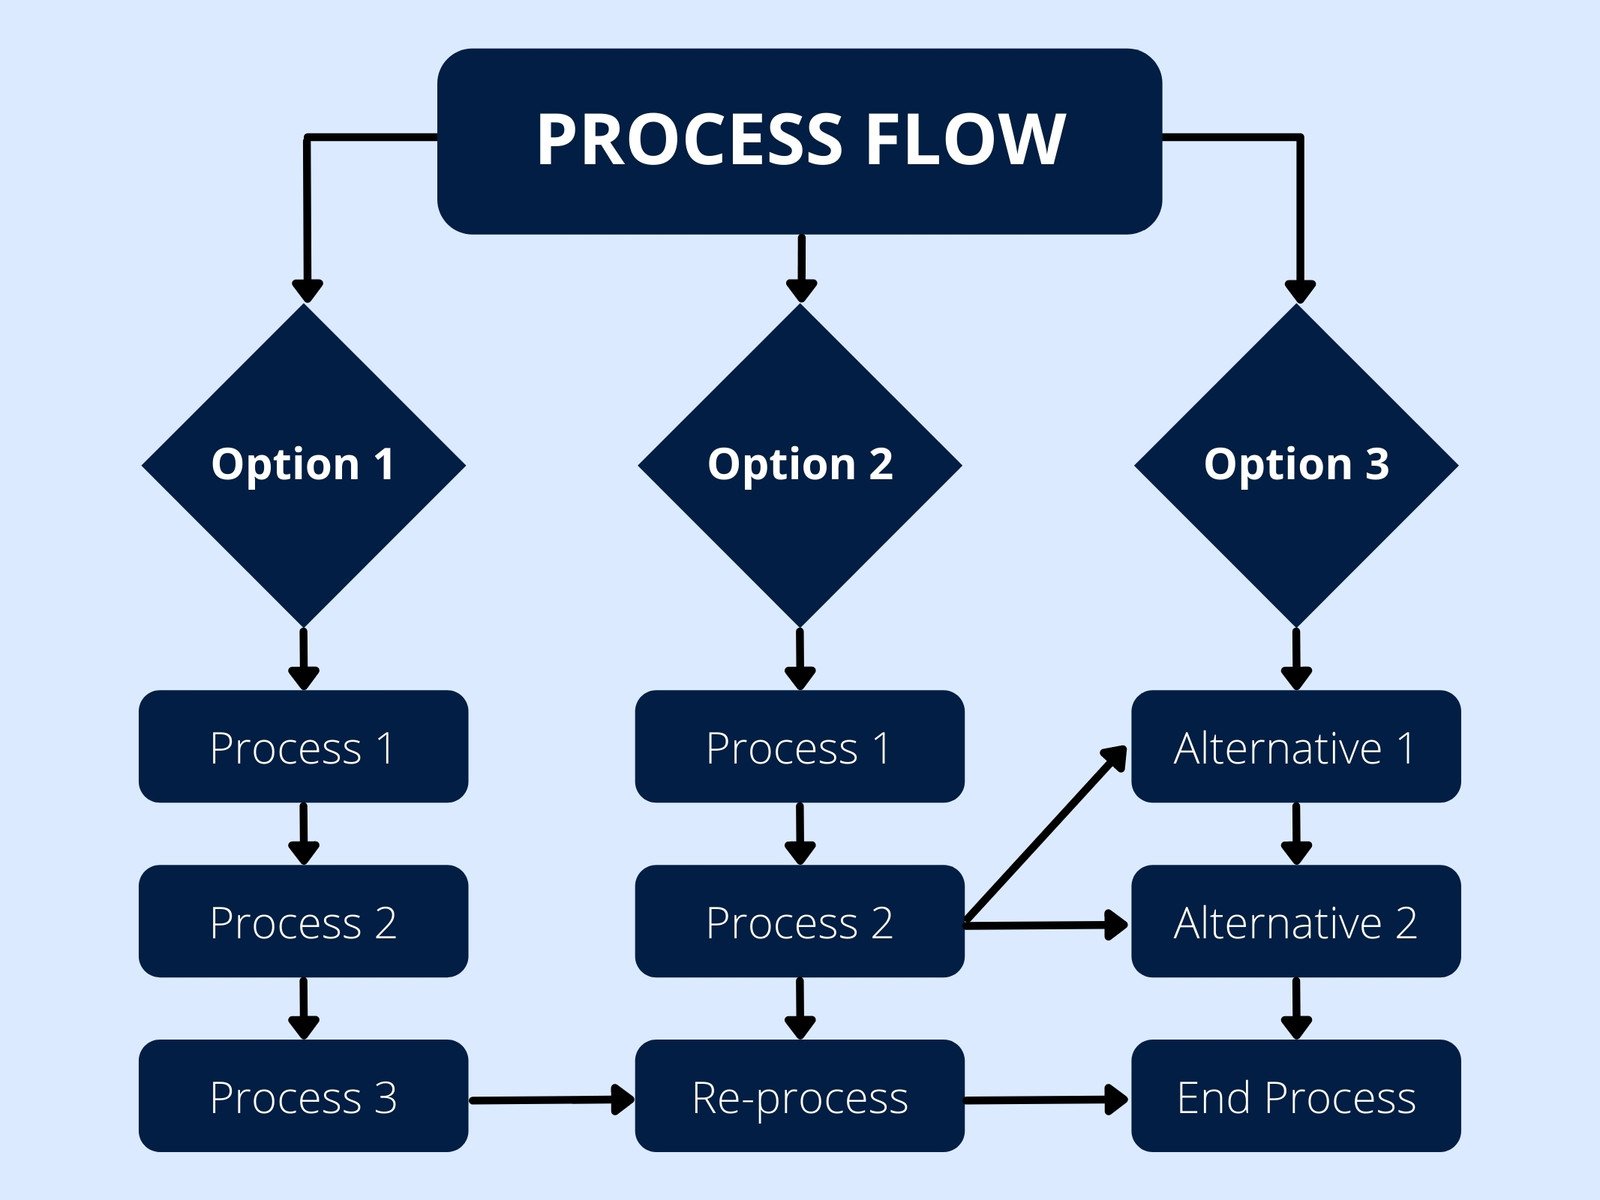
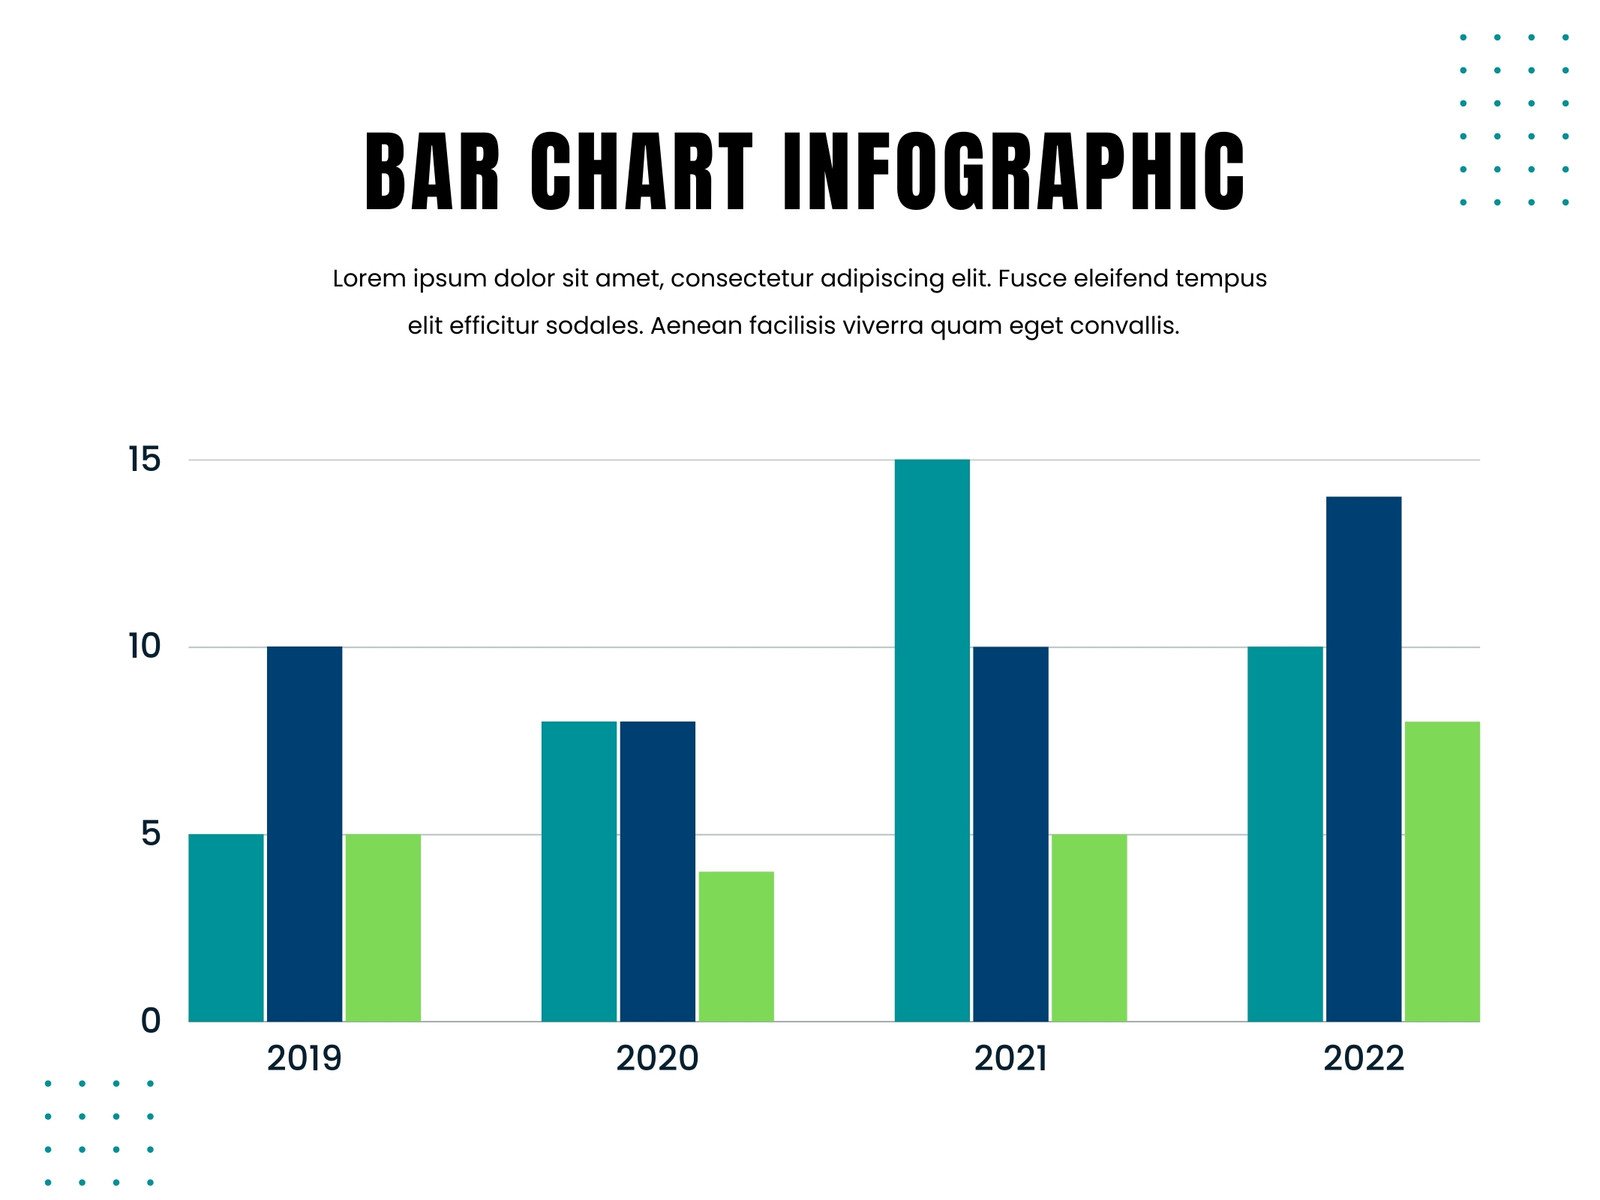
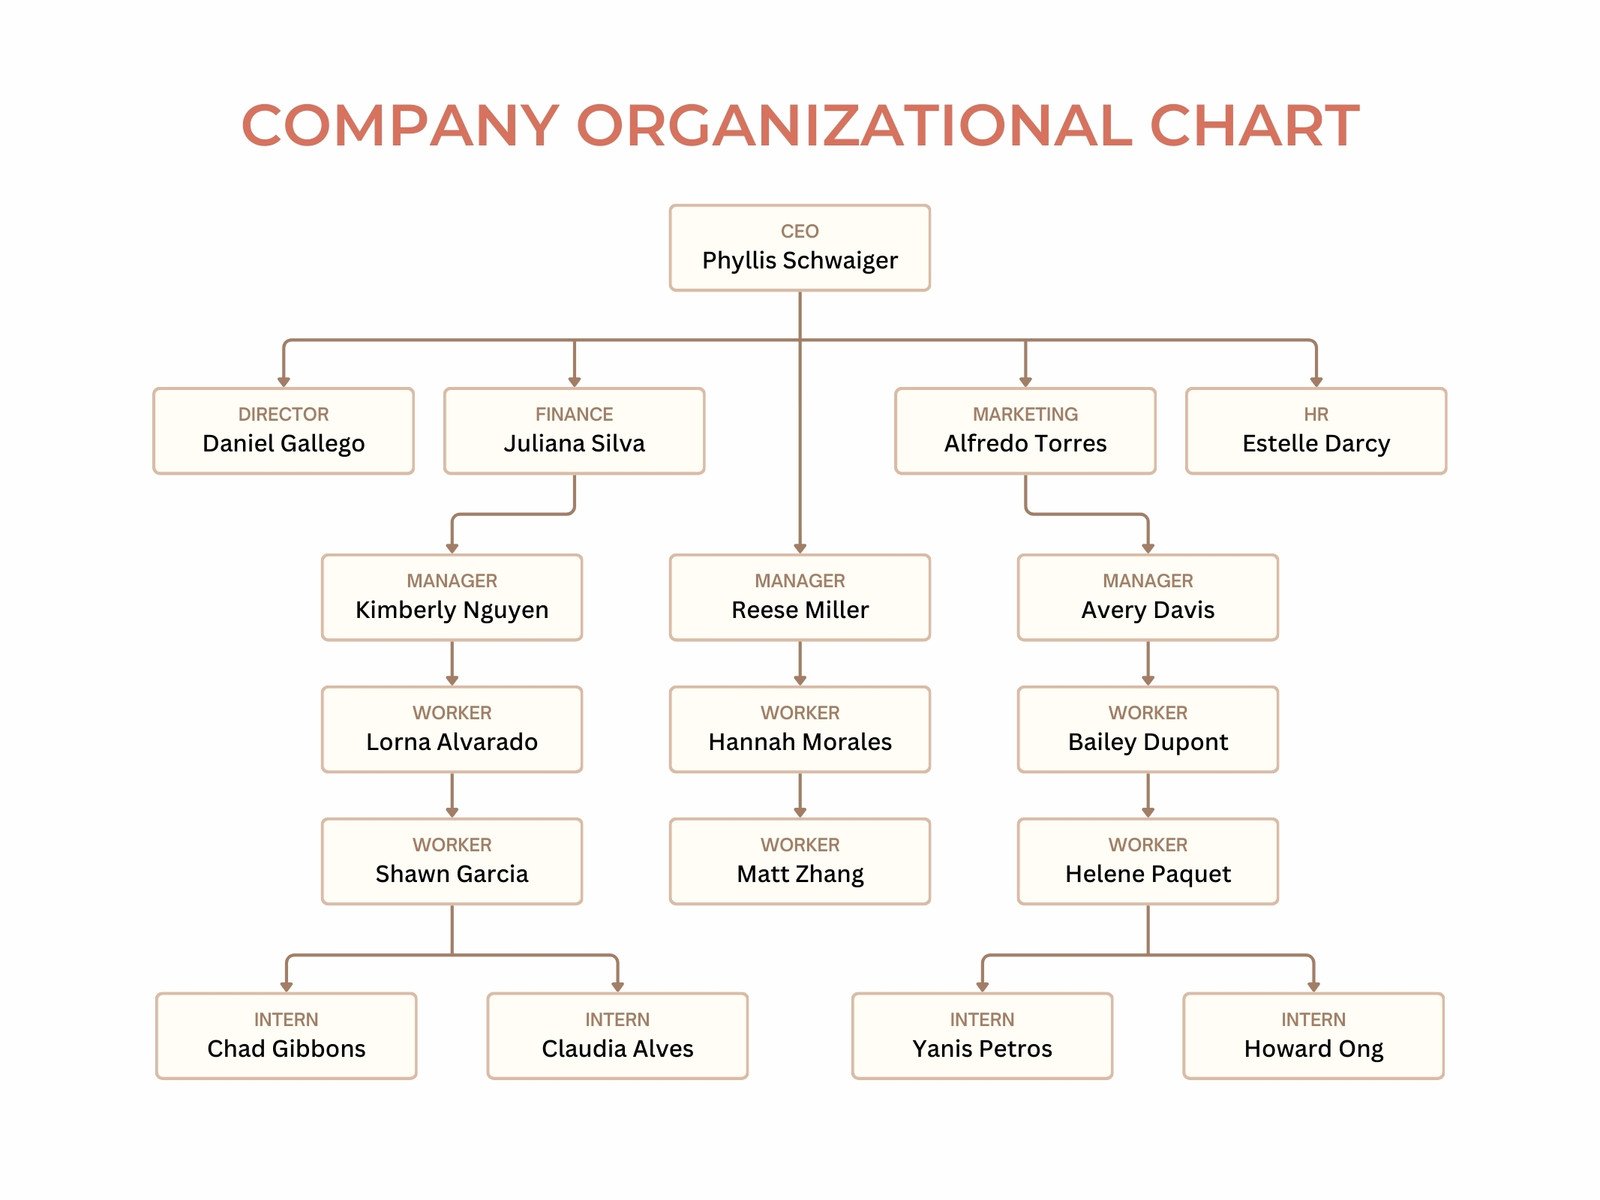
Rich chart library
Canva offers a range of free, ready-made charts — just drag and drop them to your design and type in your numbers. Switch between chart types like bar graphs, radar charts, and tree maps without losing your data.

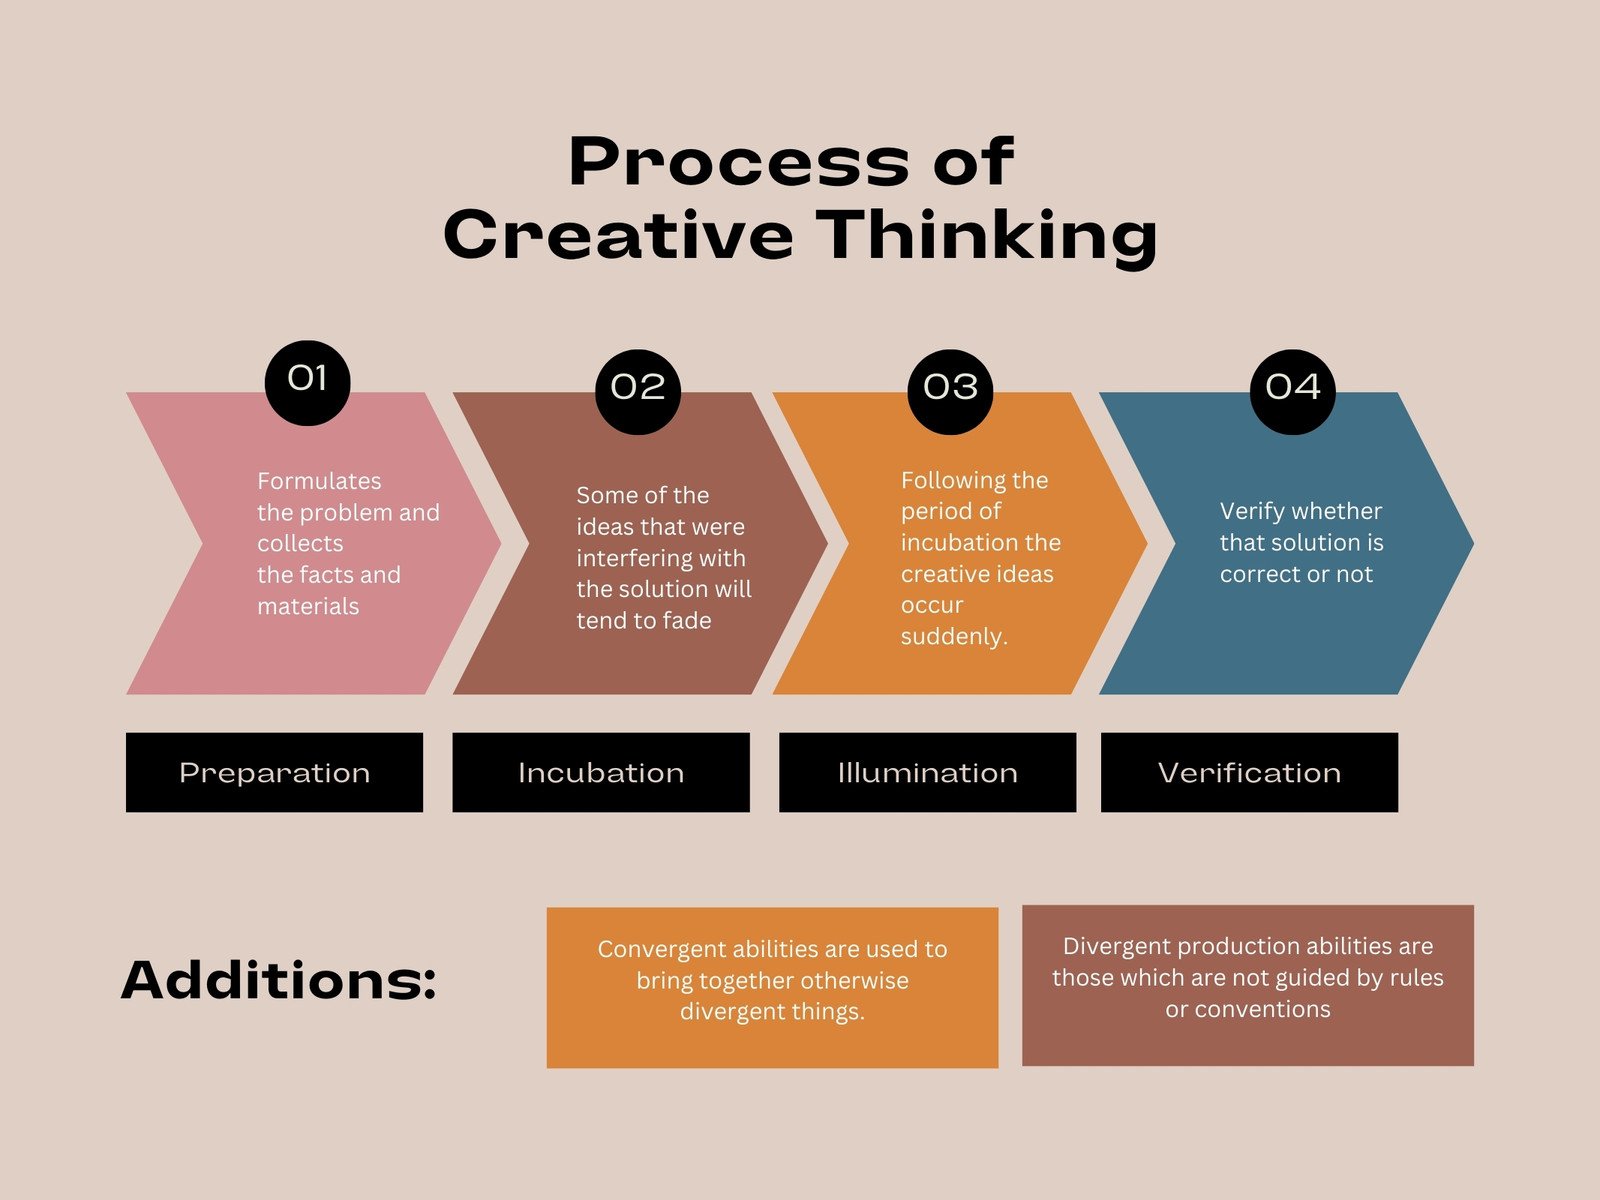
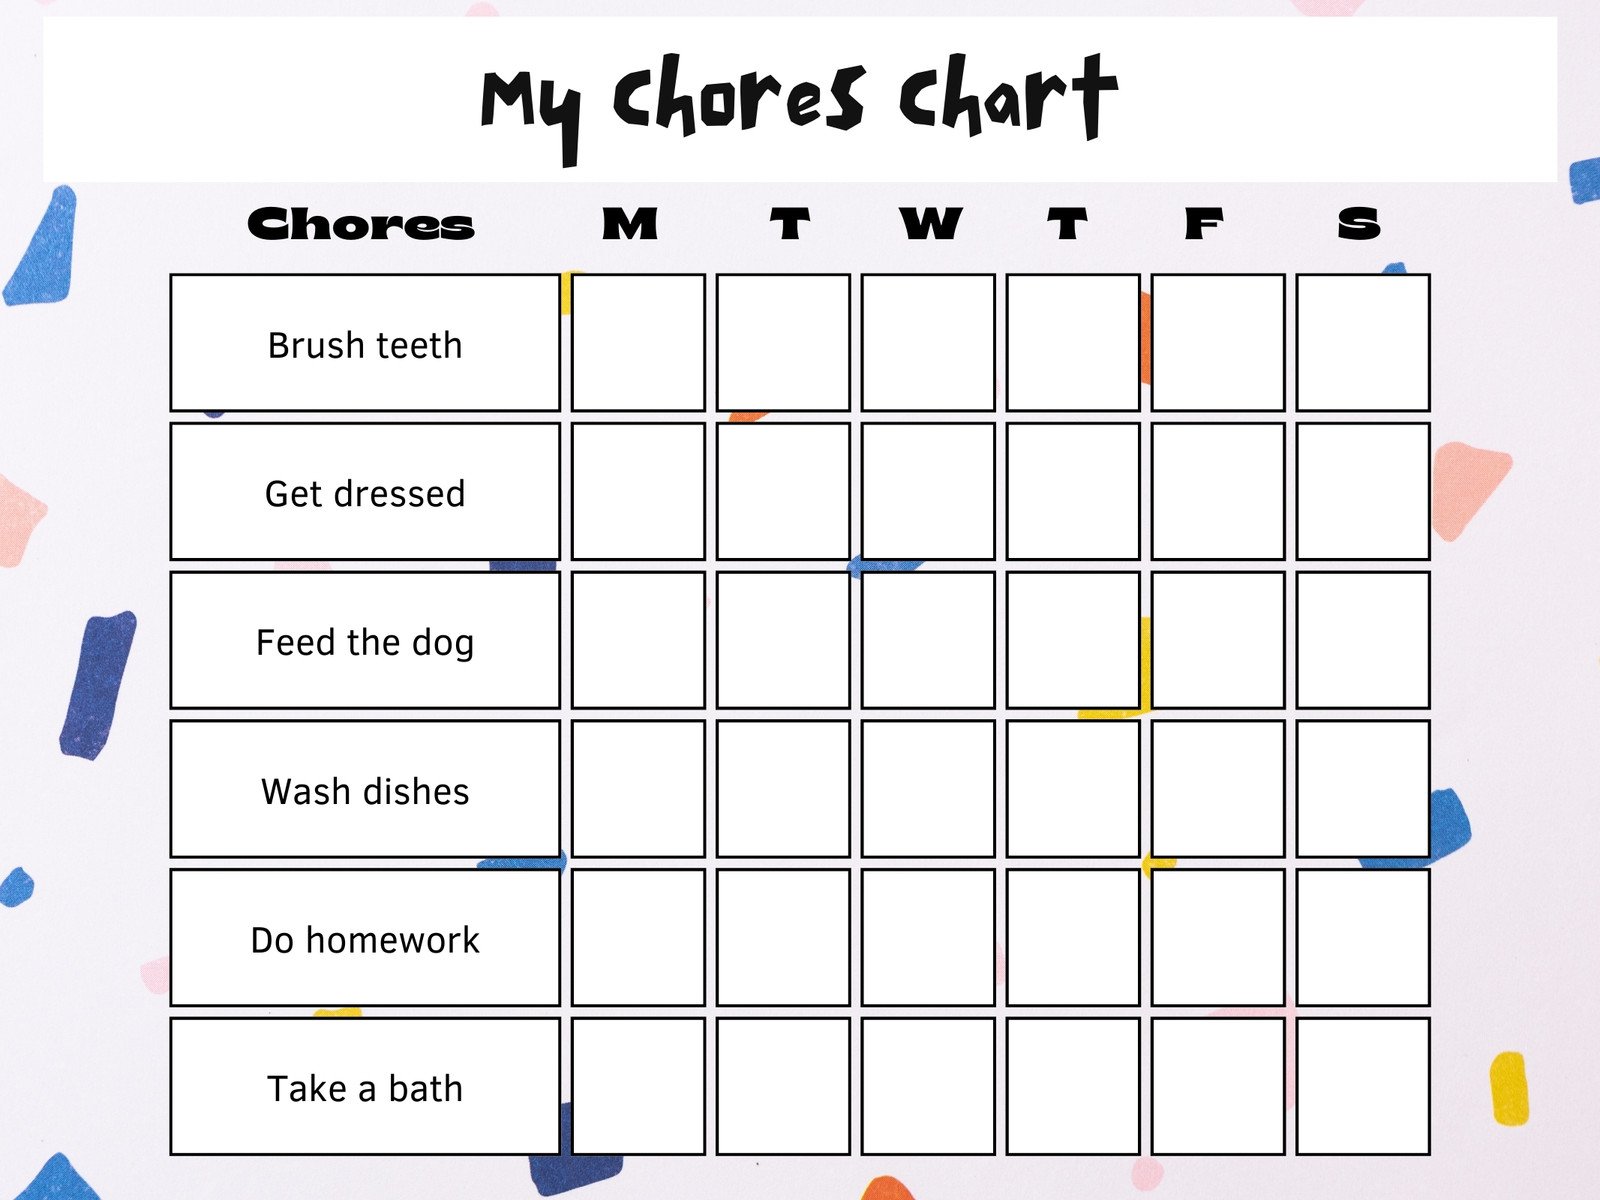
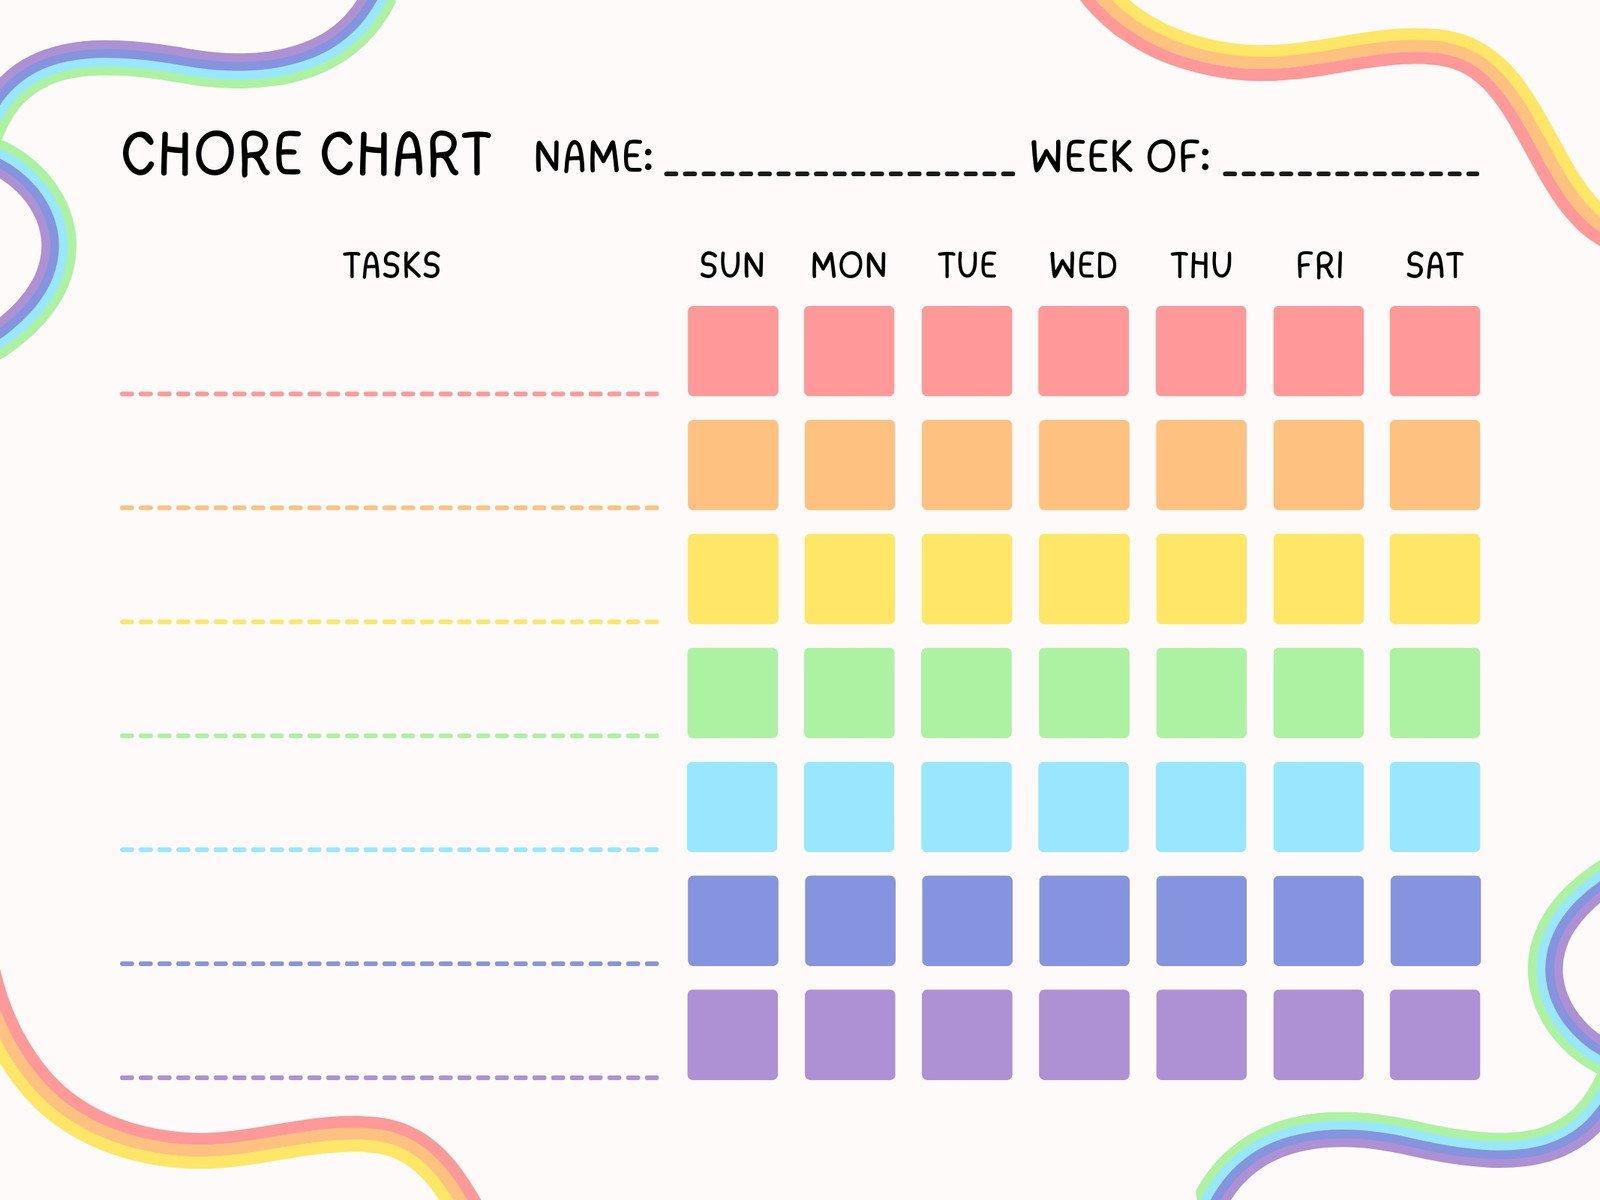
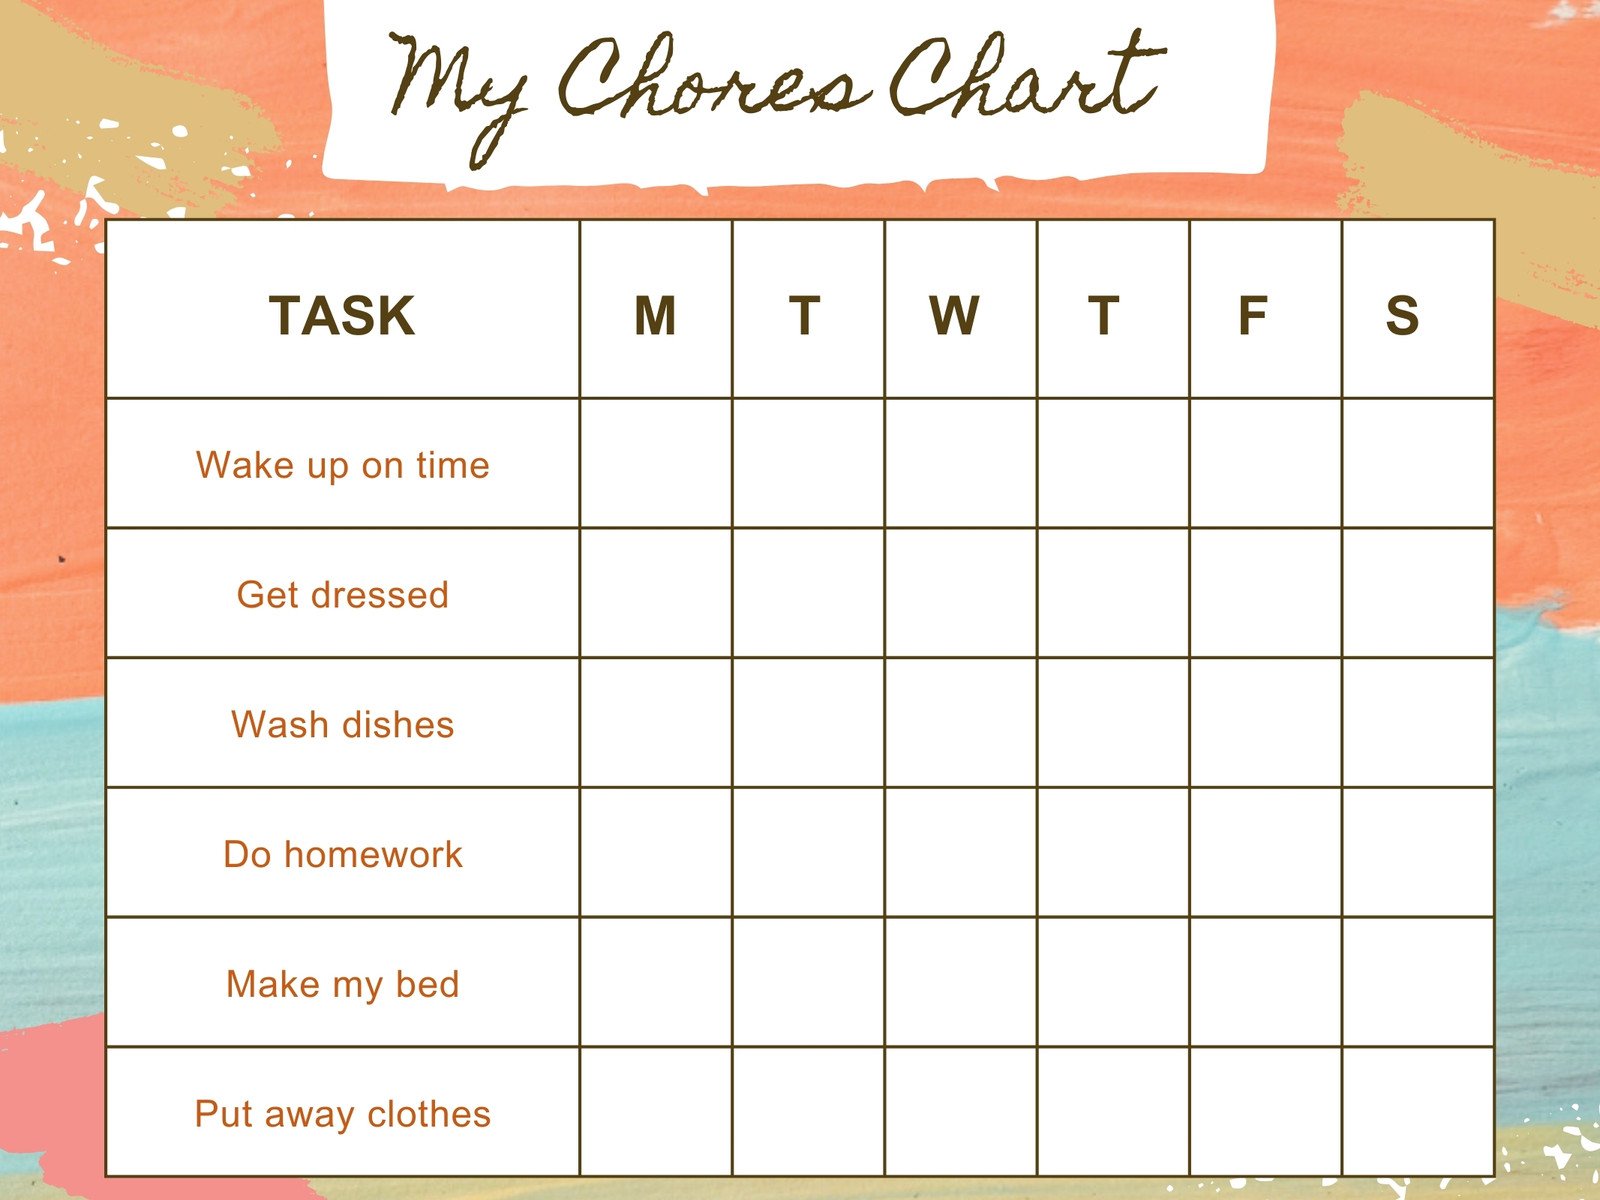
Professionally made templates
Built by data visualization experts, our templates help you share charts in beautifully designed, easy-to-understand layouts. Perfect for everything from pitch decks to reports, they make your data shine across your whole design.

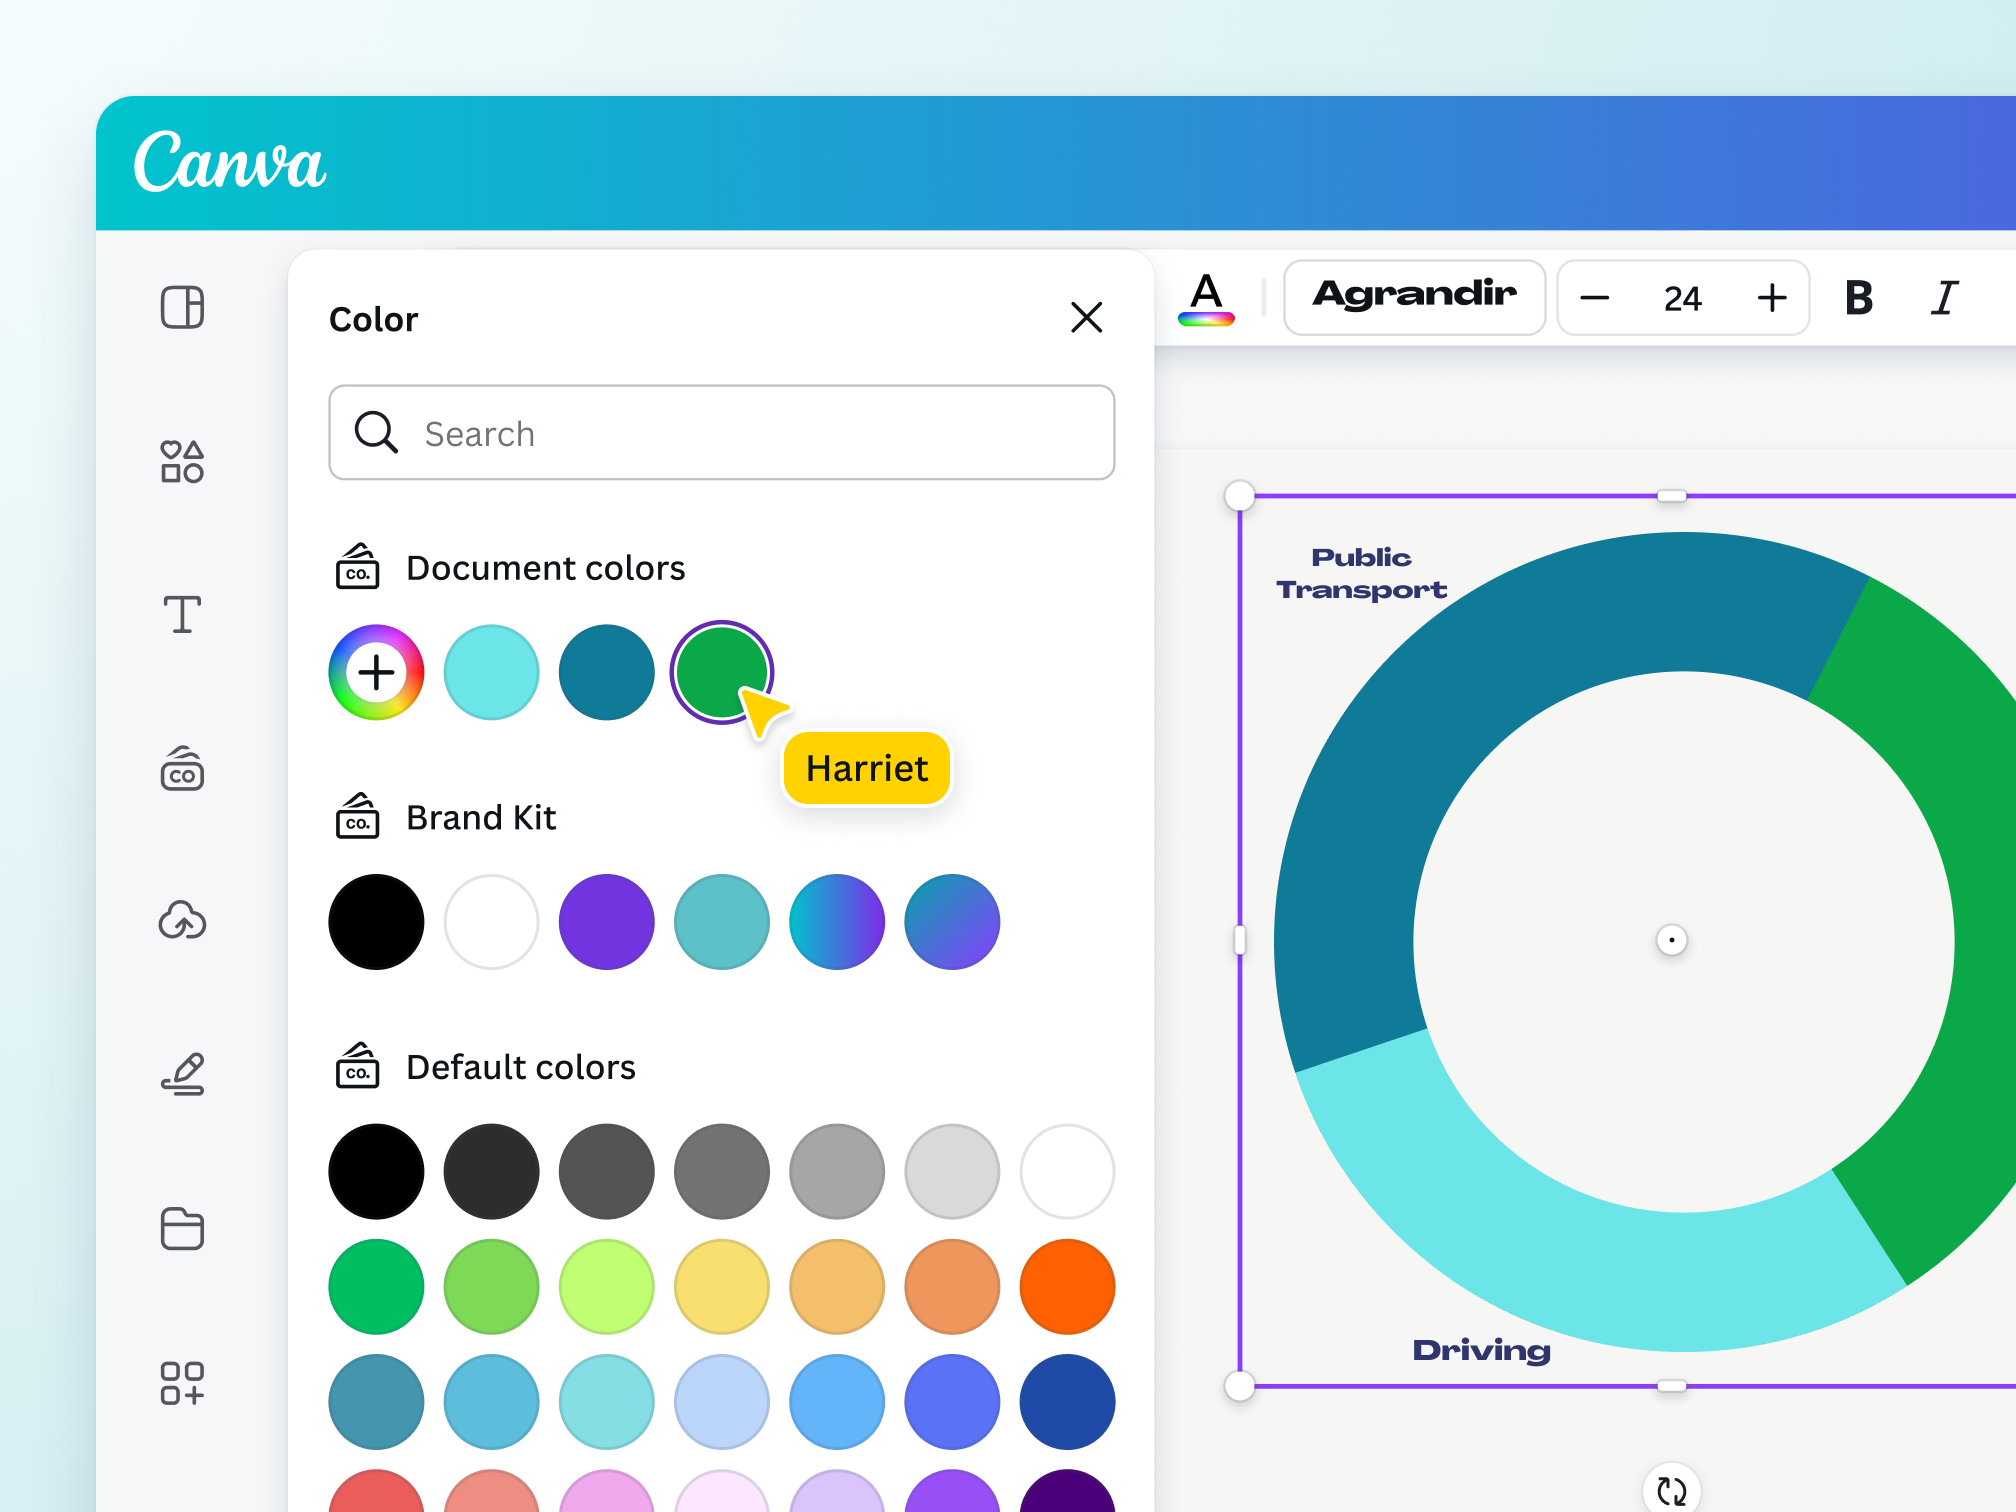
On-brand charts
Add chart styles to your Brand Kit so you can create custom graphs that stay consistent with your company’s branding.
Tell better data stories

Connect with your audience
Transform your data into powerful stories that readers can understand and explore with ease. Magic Charts lets you present the most important information first, allowing your audience to gain insights with every interaction.

Help your readers dig deeper into your data
With graphs, your audience can explore and learn more on their own, or use the filter feature to toggle between campaigns and marketing channels.

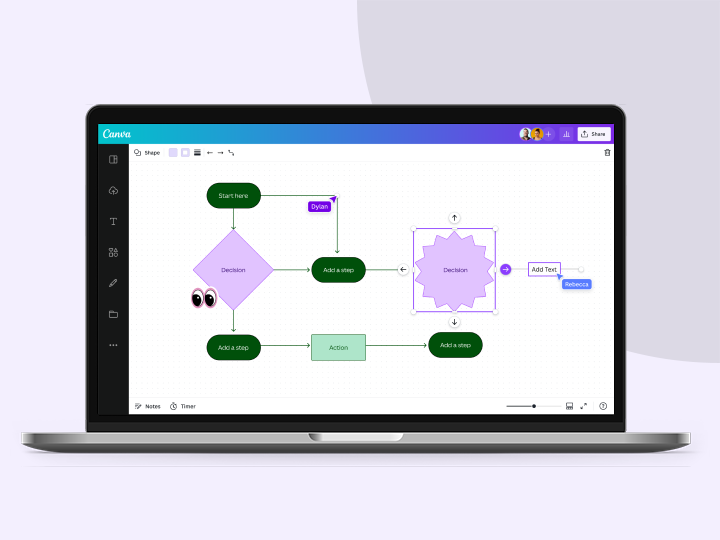
Workshop your data story with your team
Invite your teammates to create and customize your chart with you. Collaborate through comments, mentions, and reactions — all in real-time, on any Canva design.

Connect your data

Seamlessly integrate your data
Connect your data to Statista, Google Analytics, and HubSpot for a smooth workflow.

Keep it up to date
Time for a new report? Forget building new reports every month or quarter. Simply hit “Refresh Data” and watch your numbers automatically update before your eyes.

Link to existing data
Fill your charts with any data you like without the hassle of creating complicated data workflows. Just link your chart to a CSV, TSV, or XSLX file and you’re good to go.
Start inspired
We've got templates for every type of graph, so you can focus on your data.

Make beautiful data visualizations with Canva's graph maker
Skip the complexity and create eye-catching graphs quickly with our intuitive online graph maker tool.

More than 20 professional types of graphs to choose from

Professionally designed templates to fast-track your workflow

Data visualization made easy — no complicated software to learn

Publish, share or download your high-resolution graph

Embed your graph in presentations, reports and more with no fuss

Easy drag-and-drop tools, made with the non-designer in mind

Add chart styles to your Brand Kit so your charts work beautifully with your brand

Choose how to best visualize your data from chart recommendations

Engage and inspire audiences with interactive charts

Create seamless workflows with Data Connectors

Instantly turn information into stunning insights and charts with Canva Sheets

Edit your data in one central sheet, and all linked charts in your design update instantly, no manual changes needed
How to create a graph in 5 easy steps
- Select a graph or diagram template.
- Add your data or information.
- Add icons or illustrations from our library.
- Change the colors, fonts, background and more.
- Download, print or share your graph or chart.
More resources

40 of the best infographics to inspire you
Get your creative juices flowing with these visually striking infographics.

How nonprofits design their data reports
Take notes on how nonprofits use infographics to champion their causes.

How designers do it: 15 easy steps to design an infographic from scratch
Learn the best infographic design practices from the experts themselves.

The complete guide for how to marry text and images in your designs
Explore how to combine text and images in your designs.