Close Reporting

Sales reporting that actually drives revenue

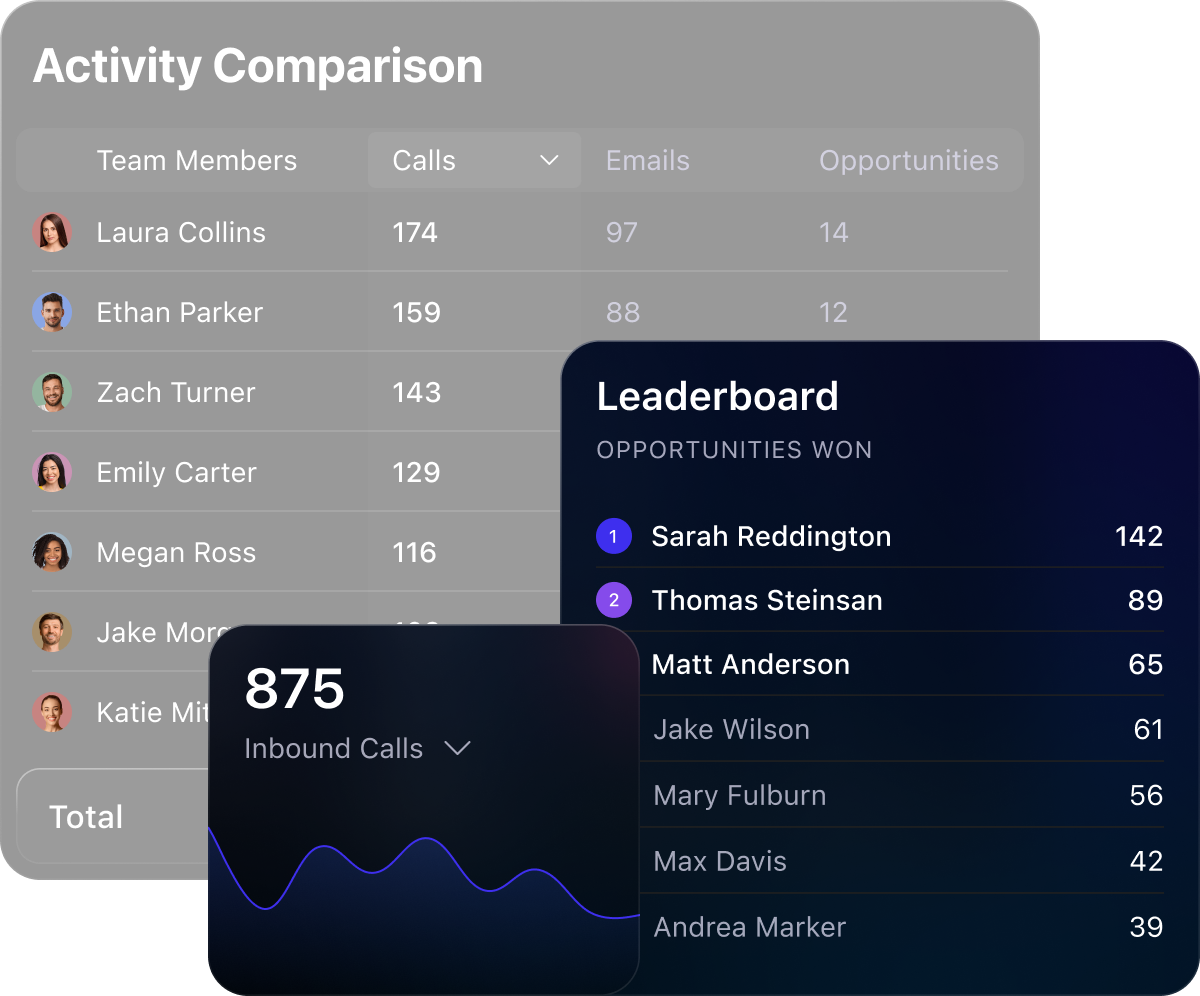
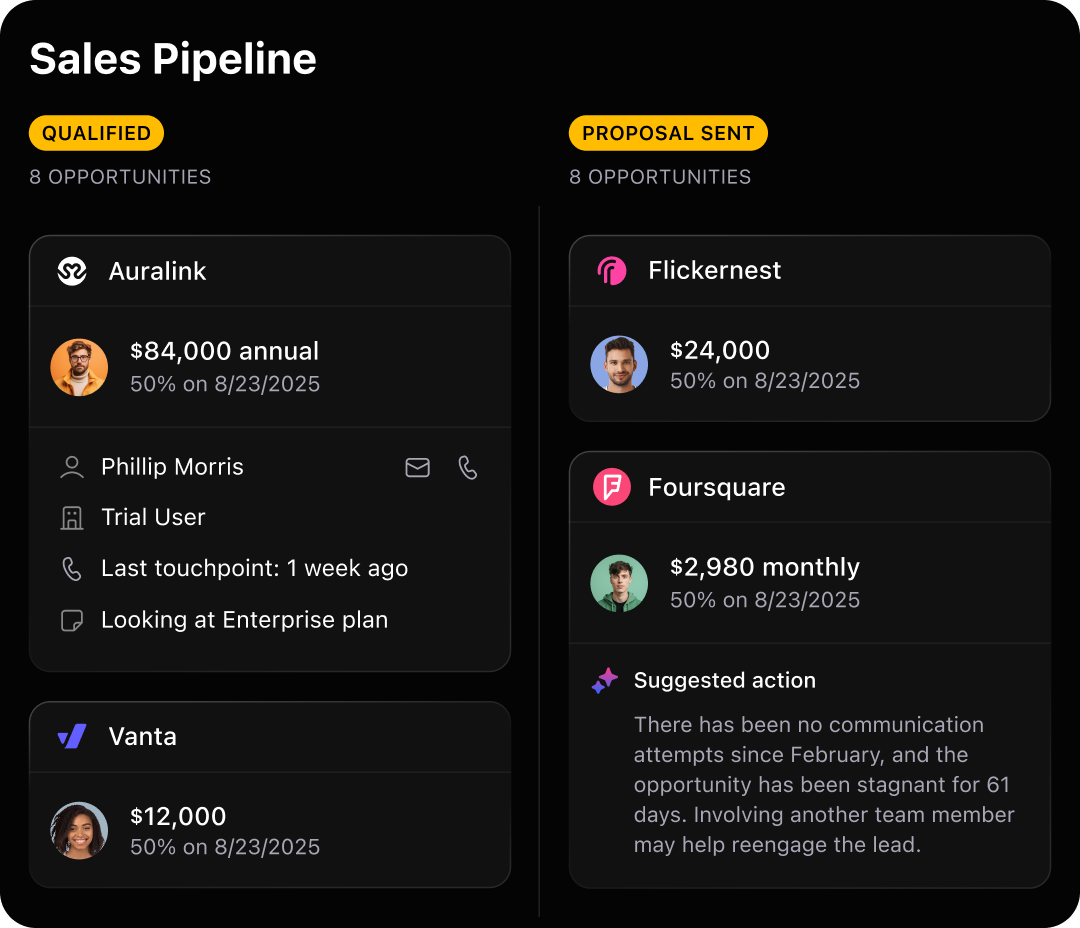
Tired of wasting time digging through data? Get clear visibility into your sales pipeline, team performance, and workflows—along with actionable insights to grow revenue.

Team activity comparison table for calls, emails, and opportunities with leaderboard and call graph.

See what’s working. Fix what’s not.

Close Reporting gives you the visibility you need to optimize performance, make data-driven decisions, and keep deals moving.
Enhanced sales visibility
Get instant clarity into pipeline and deal progress.
Data-driven decision making
Use real-time insights to guide every decision.
Performance optimization
Track reps, coach smarter, and boost team output.
Streamlined reporting
Replace spreadsheets with built-in, customizable reports.
ImageImage

Reporting designed to move deals forward

Track pipeline health

Analyze easy-to-read pipeline data

Use Opportunity reporting to quickly see your pipeline by stage, value, and close date. Spot deal volume trends, forecast revenue, and catch bottlenecks that could slow down your sales cycle.
Sales funnel chart showing stages, days, and percentages from New Lead to Won, with a Save As button.
Monitor rep performance

Coach sales reps better with the right reporting

Track rep performance across calls, emails, tasks, and deals. See who’s driving pipeline momentum and who needs support. Coach smarter and drive consistent activity across your team.
Report card showing avatars with emails and opportunities counts, total emails 1,002 and opportunities 90.
Identify stalled deals

Flag stuck deals before they go cold or churn

Build reports that surface neglected deals. Give reps a clear re-engagement list before momentum dies and your pipeline leaks revenue.
Report card showing logos, contact icons for phone and email, with check marks and X marks on a white background.
Measure performance

Refine your workflows using data, not guessing

Track how leads move through your workflows, from first touch to close. Measure the performance of automated emails and calls, then use the data to refine your process and boost conversion at every stage.
Vertical bar chart with green and black segments beneath four small icons in blue, pink, green, and purple.

Clear, easy-to-read sales data without dashboard digging

Opportunity Reporting

Track deals by stage, expected close date, and value.Spot pipeline gaps, estimate potential revenue, and focus your team on high-impact deals.

Custom Pipeline Views

Break down your pipeline by team, rep, source, or product line. Drill into the details that drive performance and pinpoint what’s working where.

Pipeline Stage Reports

See how many deals are in each stage of your sales flow.
Spot friction points and keep your pipeline moving forward.

Expected Revenue Views

Forecast revenue with precision. Use expected close dates and deal values to project both near-term and long-term revenue.
Sales pipeline showing qualified and proposal sent stages with company info, values, and contact details.

Activity Reporting

Track outbound effort across calls, emails, texts, and meetings. Ensure reps follow up and work is spread evenly across the team.

Rep-Level Reporting

See how each rep is performing in deals closed, activity volume, and conversion rates. Use this data to coach more effectively.

Leaderboards & Comparisons

Make rep performance visible to the whole team. Encourage healthy competition and give everyone a reason to level up.

Conversion Rate Tracking

Track how reps convert leads across the funnel. Spot skill gaps and coach with precision to boost close rates.
Table showing activity comparison of team members with calls, emails, and opportunities counts.Image

Dashboard Customization

Build dashboards for different teams, roles, or goals. Mix and match activity, pipeline, and revenue data in one view that’s tailored to what you care about.

Saved Reports & Filters

Quickly access your go-to reports. Filter by lead owner, status, source, or custom fields, then save views to revisit later or share with your team.

Real-Time Data

No refreshing. No delays. Reports update automatically, so you're always working with current data, perfect for leadership check-ins.

Easy Sharing

Keep the entire team in the loop. Share insights in meetings, send CSV exports, or display dashboards live without needing help from ops.
Dashboard showing custom fields with values like Hiring, Ideal Customer, Company Size, Industry, and Lead Owner Laura Stegal.Image

9 out of 10 new users start using Close to place calls, send emails + texts, or host a meeting within their first week.

Smiling diverse team members on purple circles with call, email, chat, and calendar icons.

Why small businesses love Close.
Yes, love. (Really.)

Hands down the best CRM I’ve ever used! This is a CRM for a sales team that wants to integrate email, phone, SMS and work QUICK. Entering a new lead takes seconds, updating a lead takes seconds. I've never seen a CRM do this!
When it comes to a CRM that helps you manage the sales cycle as a small or medium-sized business, I've not encountered a better system out there. We've tried scores of them over the years including Salesforce.
ImageImageImageImageImage
Image

Make smarter sales moves with Close

Try Close free for 14 days and uncover your pipeline weak spots. No credit card required.
Graph showing email activity by date and direction with lines for incoming and outgoing emails.

Frequently Asked Questions

Image

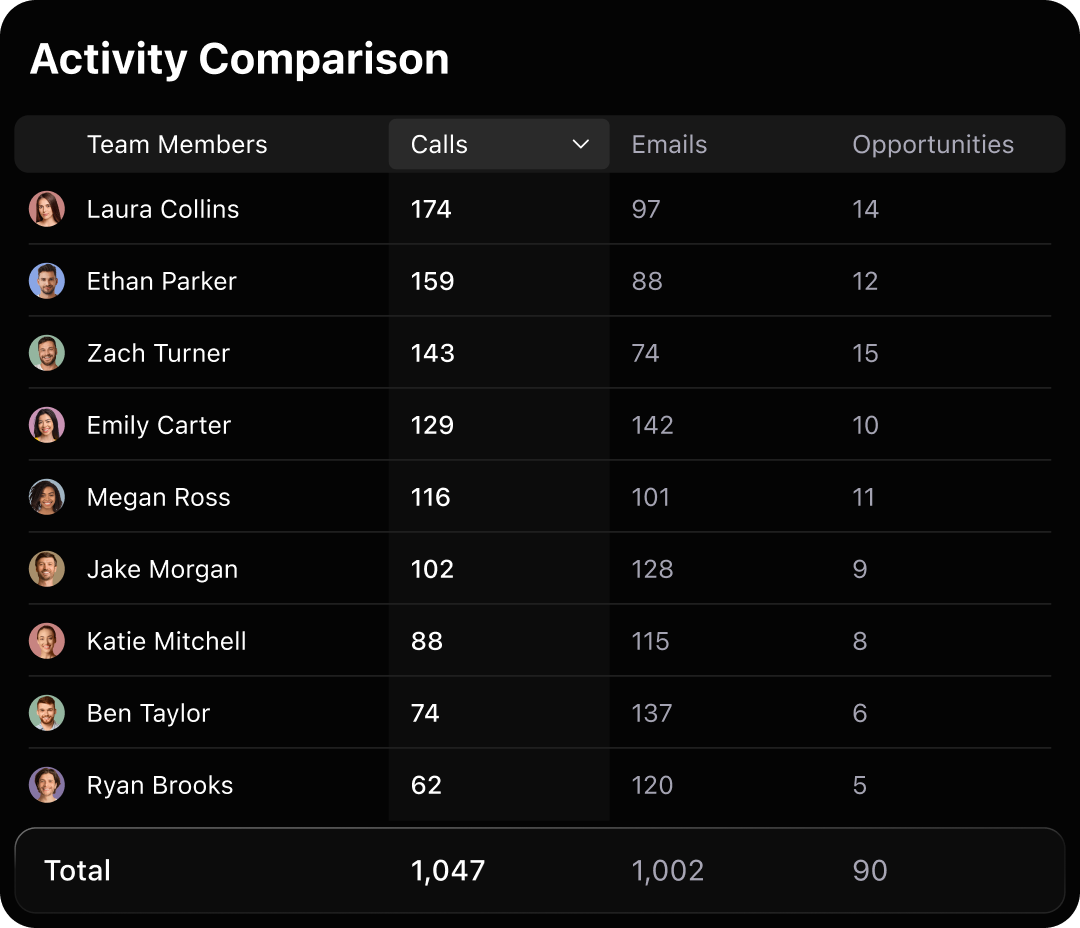
What types of reports can I build in Close?

Image

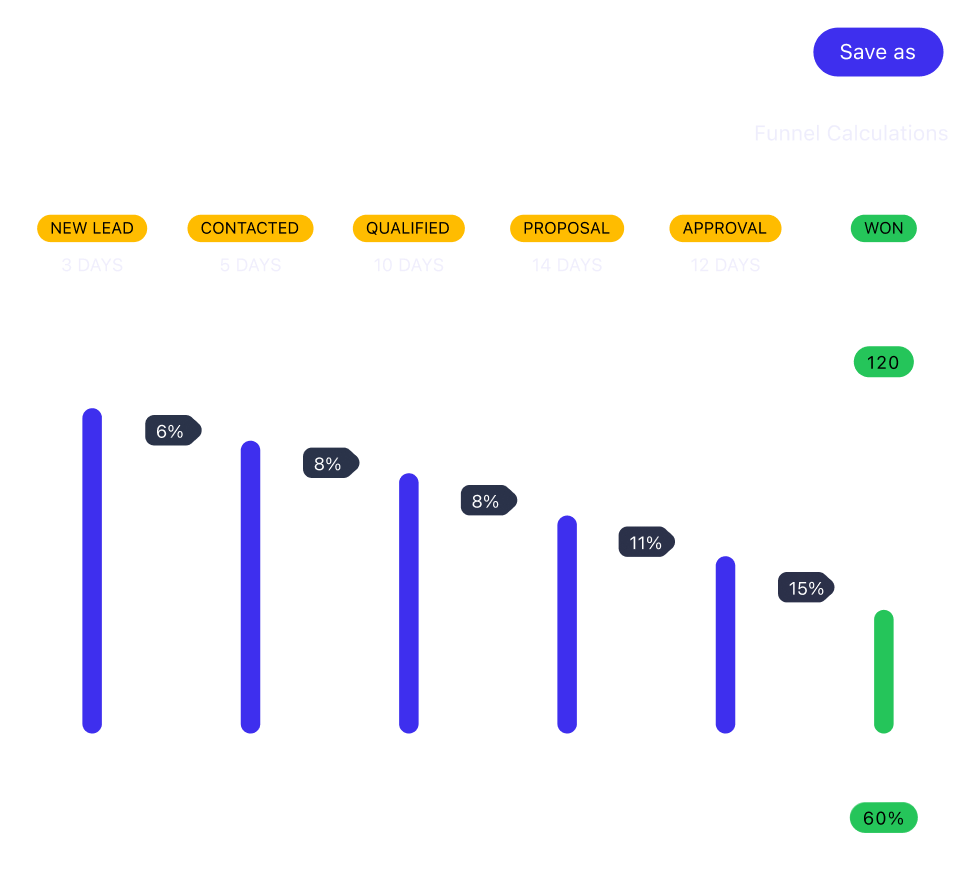
Close offers flexible reports for tracking team activity, sales performance, pipeline health, and lead conversion. You can visualize key metrics with customizable charts and dashboards or dive into granular views using filters and date ranges to surface the exact insights you need.

Image

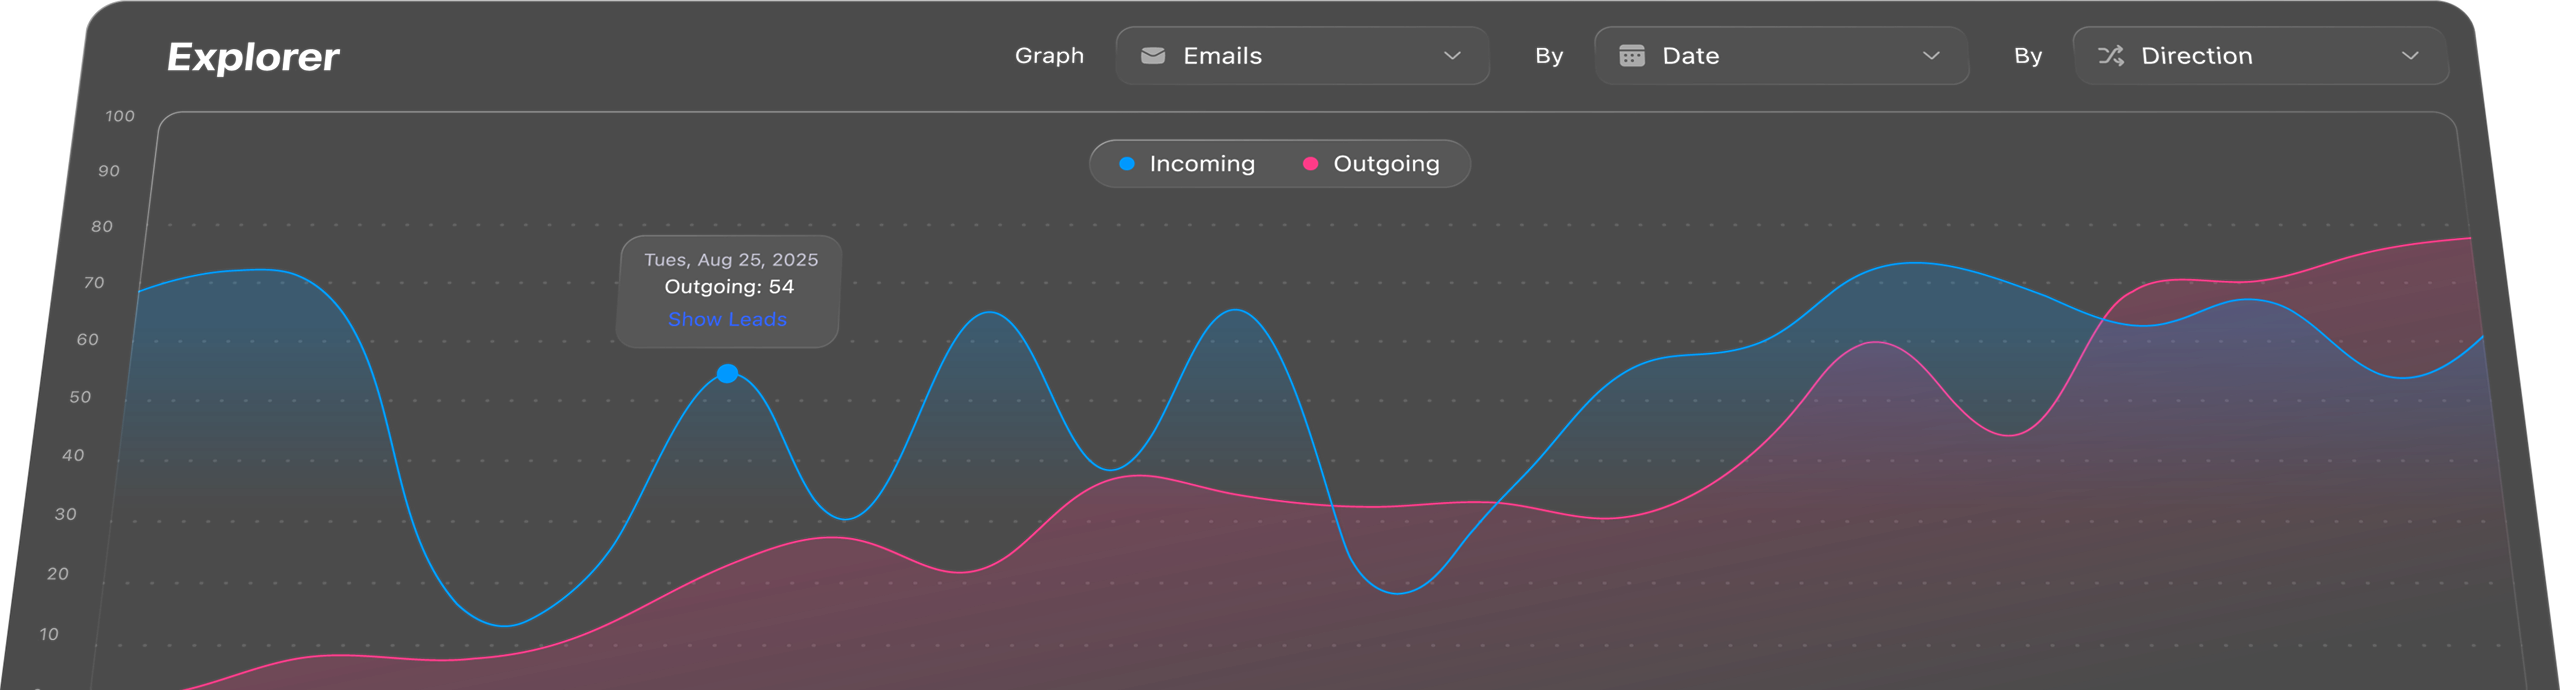
Can I create custom dashboards for my team?

Image

Yes! You can build multiple dashboards tailored to different use cases, like individual rep performance, pipeline forecasts, or executive summaries. Dashboards are easy to share, and each team member can pin the ones most relevant to their role.

Image

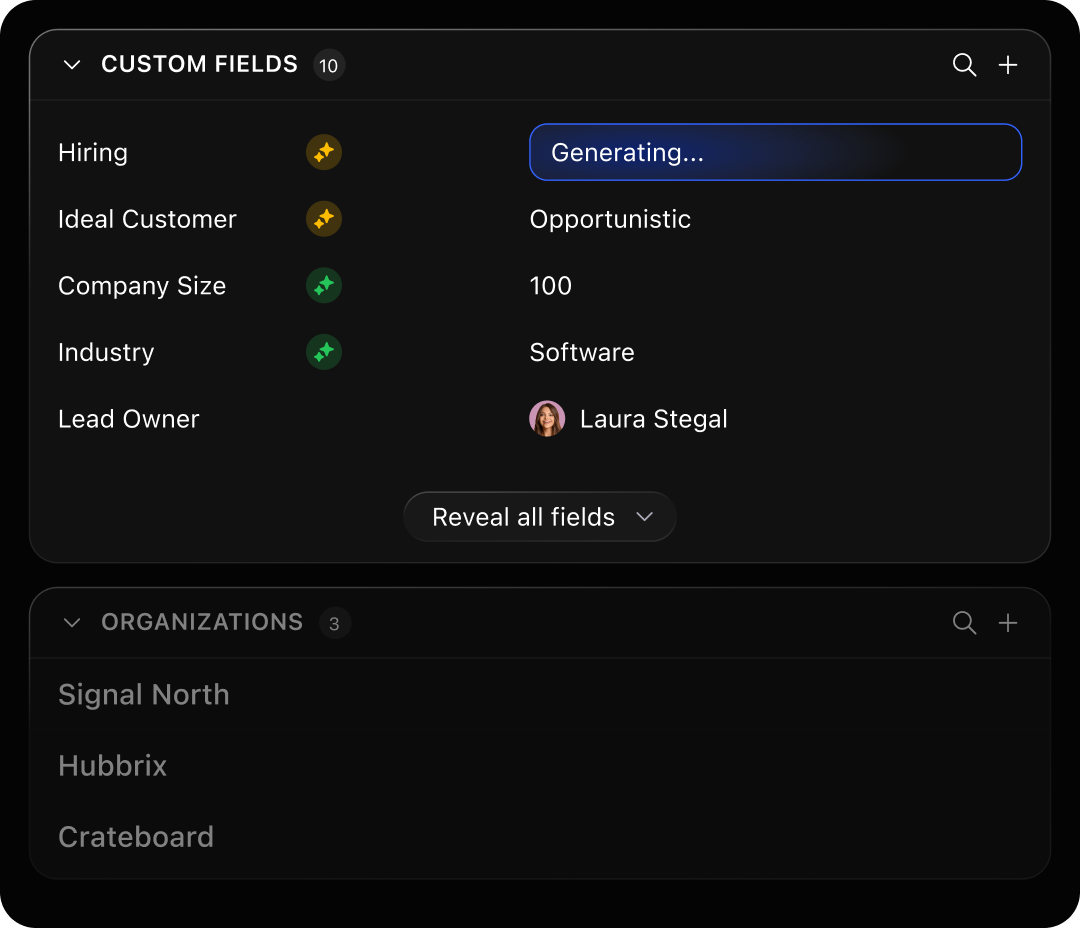
Is real-time data available in the reports?

Image

Absolutely. Reports in Close update in real time, so your dashboards always reflect the latest calls, emails, opportunities, and sales outcomes. No need to manually refresh or export.

Image

Do I need a technical background to use the reporting tools?

Image

Not at all. Close’s reporting tools are built for sales teams, not data analysts. You don’t need to write SQL or use spreadsheets. Everything is point-and-click, so anyone on your team can explore data and get actionable insights.

Image

Can I export or share reports outside of Close?

Image

Yes. You can easily export reports to CSV for further analysis or send visual dashboards via screenshot or screen share. That way, you can keep leadership, clients, or stakeholders in the loop even if they don’t use Close.