


LightningChart Python Performance Benchmark
Here’s how LightningChart Python compares to other libraries.
Summary Results
The following results are on average, and highlight how much faster LightningChart Python is compared to other Python plotting libraries.

LightningChart® Python is
12,892x faster
than average of other libraries tested.
In real-time tests, LightningChart Python performed approximately 7,071x faster than Competitor B and about 188x faster than Competitor A.
In static tests, LightningChart Python performed approximately 44,214x faster than Competitor B and about 96x faster than Competitor A.

With these results, LightningChart Python demonstrates a substantial advantage in data rendering efficiency for both real-time and static data visualizations.


Libraries Tested
In the realm of Python graphing libraries, there are several data visualization libraries to choose from. Matplotlib and Plotly are some of the most popular options chosen by data scientists, researches, engineers, and universities.
This test demonstrates how LightningChart Python is the most performant Python graphing library capable to meet and surpass the needs of those users who require the best data visualization library for their projects.
Both libraries’ results are protected under aliases and are displayed in no particular order.


Evaluation
We conducted static and real-time performance tests on different chart types in both 2D and 3D visualizations.
Streaming Data Performance
A parameter that measures how efficiently each charting library can consume and display streaming data.
Maximum Data Capacity
A parameter that measures how large are the datasets that each solution can visualize. Scores are measured as numbers of data points across all channels.
The different chart types evaluated were the following:
| Solution | Real-time test: points / second | Static test: data points rendered |
|---|---|---|
| LightningChart Python | 3,000,000 data points per second | 100,000,000 data points |
| Competitor A | 15,000 data points per second | 7,100,000 data points |
| Competitor B | 1,000 data points per second | 50,000 data points |
LightningChart Python
Static test: data points rendered
100,000,000 data points
Real-time test: points / second
3,000,000 data points per second
Competitor A
Static test: data points rendered
7,100,000 data points
Real-time test: points / second
15,000 data points per second
Competitor B
Static test: data points rendered
50,000 data points
Real-time test: points / second
1,000 data points per second
Performance gain:
Real-time tests
LightningChart Python is:
588x faster than Competitor A
26,401x faster than Competitor B
Static tests
LightningChart Python is:
42x faster than Competitor A
29,277x faster than Competitor B
| Solution | Real-time test: points / second | Static test: data points rendered |
|---|---|---|
| LightningChart Python | 100,000 data points per second | 665,000 data points |
| Competitor A | 65,000 data points per second | 460,000 data points |
| Competitor B | 300 data points per second | 5,000 data points |
LightningChart Python
Static test: data points rendered
665,000 data points
Real-time test: points / second
100,000 data points per second
Competitor A
Static test: data points rendered
460,000 data points
Real-time test: points / second
65,000 data points per second
Competitor B
Static test: data points rendered
5,000 data points
Real-time test: points / second
300 data points per second
Performance gain:
Real-time tests
LightningChart Python is:
2× faster than Competitor A
346× faster than Competitor B
Static tests
LightningChart Python is:
1.4× faster than Competitor A
498× faster than Competitor B
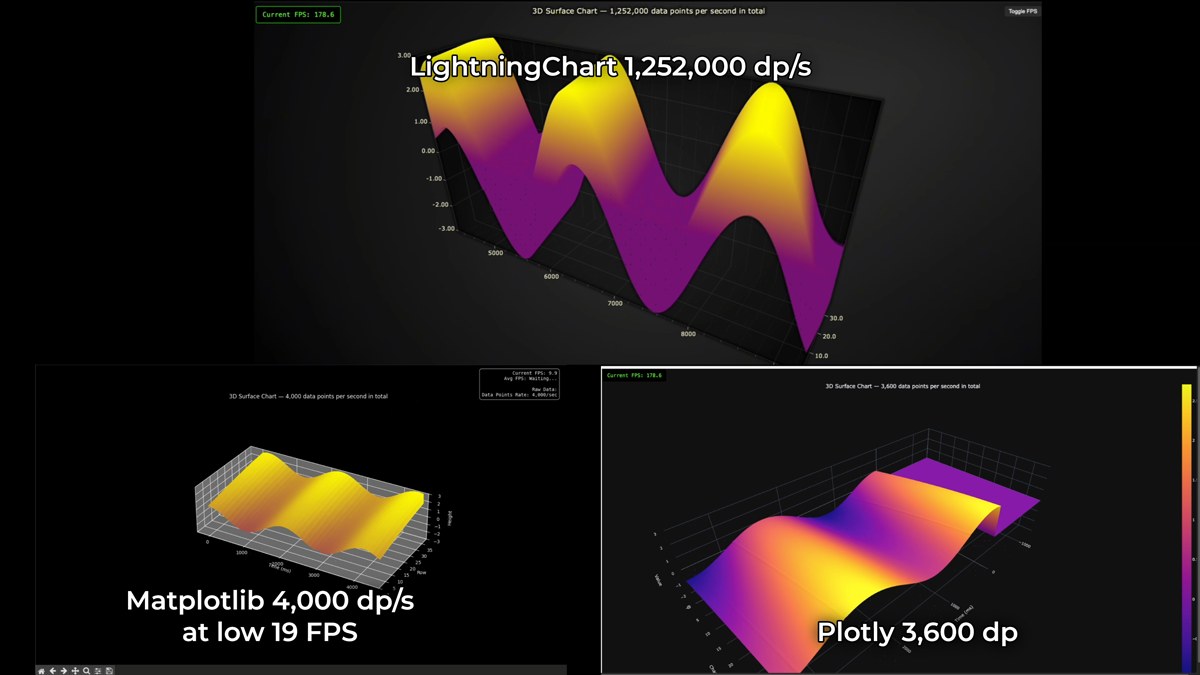
| Solution | Real-time test: points / second | Static test: data points rendered |
|---|---|---|
| LightningChart Python | 55,000 data points per second | 1,900,000 data points |
| Competitor A | 15,000 data points per second | 1,150,000 data points |
| Competitor B | 600 data points per second | 1,000 data points |
LightningChart Python
Static test: data points rendered
1,900,000 data points
Real-time test: points / second
55,000 data points per second
Competitor A
Static test: data points rendered
1,150,000 data points
Real-time test: points / second
15,000 data points per second
Competitor B
Static test: data points rendered
1,000 data points
Real-time test: points / second
600 data points per second
Performance gain:
Real-time tests
LightningChart Python is:
4× faster than Competitor A
94× faster than Competitor B
Static tests
LightningChart Python is:
1.85× faster than Competitor A
6,751× faster than Competitor B
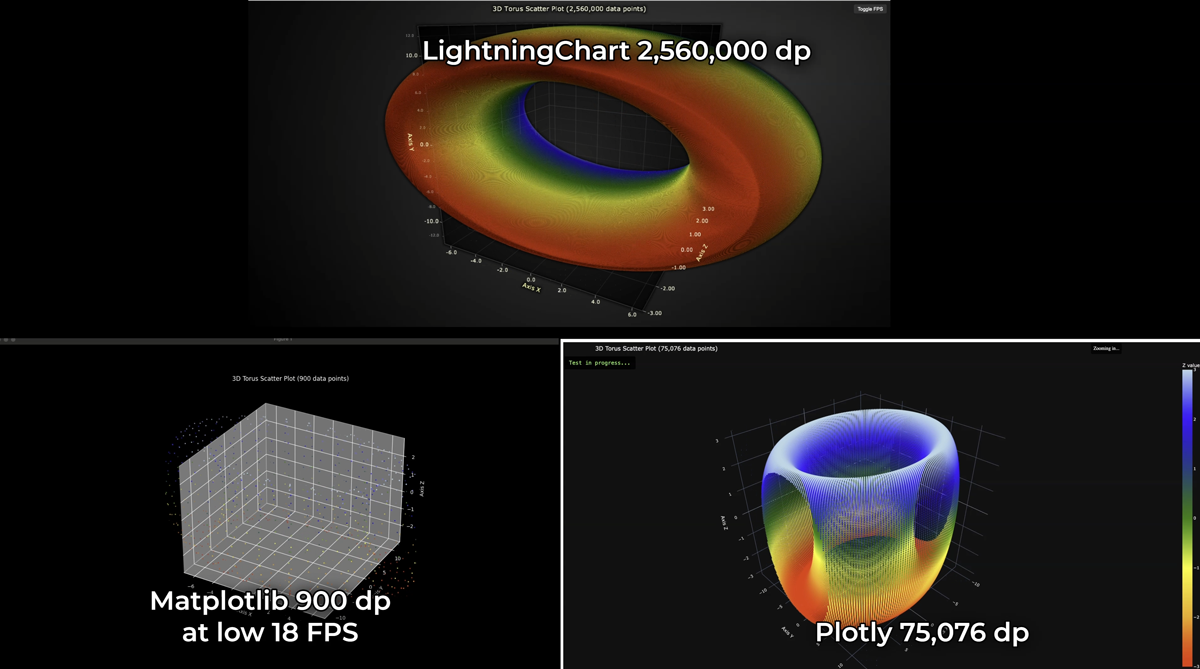
| Solution | Real-time test: points / second | Static test: data points rendered |
|---|---|---|
| LightningChart Python | 340,000 data points per second | 2,560,000 data points |
| Competitor A | 4,000 data points per second | 75,076 data points |
| Competitor B | 50 data points per second | 900 data points |
LightningChart Python
Static test: data points rendered
2,560,000 data points
Real-time test: points / second
340,000 data points per second
Competitor A
Static test: data points rendered
75,076 data points
Real-time test: points / second
4,000 data points per second
Competitor B
Static test: data points rendered
900 data points
Real-time test: points / second
50 data points per second
Performance gain:
Real-time tests
LightningChart Python is:
87× faster than Competitor A
9,231× faster than Competitor B
Static tests
LightningChart Python is:
33× faster than Competitor A
9,939× faster than Competitor B
| Solution | Real-time test: points / second | Static test: data points rendered |
|---|---|---|
| LightningChart Python | 62,500 data points per second | 20,000,000 data points |
| Competitor A | 3,750 data points per second | 220,000 data points |
| Competitor B | 1,000 data points per second | 400 data points |
LightningChart Python
Static test: data points rendered
20,000,000 data points
Real-time test: points / second
62,500 data points per second
Competitor A
Static test: data points rendered
220,000 data points
Real-time test: points / second
3,750 data points per second
Competitor B
Static test: data points rendered
400 data points
Real-time test: points / second
1,000 data points per second
Performance gain:
Real-time tests
LightningChart Python is:
16× faster than Competitor A
1,913× faster than Competitor B
Static tests
LightningChart Python is:
94× faster than Competitor A
192,451× faster than Competitor B
| Solution | Real-time test: points / second | Static test: data points rendered |
|---|---|---|
| LightningChart Python | 16,000,000 data points per second | 225,000,000 data points |
| Competitor A | 40,000 data points per second | 1,850,000 data points |
| Competitor B | 40,000 data points per second | 100,000 data points |
LightningChart Python
Static test: data points rendered
225,000,000 data points
Real-time test: points / second
16,000,000 data points per second
Competitor A
Static test: data points rendered
1,850,000 data points
Real-time test: points / second
40,000 data points per second
Competitor B
Static test: data points rendered
100,000 data points
Real-time test: points / second
40,000 data points per second
Performance gain:
Real-time tests
LightningChart Python is:
428× faster than Competitor A
4439× faster than Competitor B
Static tests
LightningChart Python is:
403× faster than Competitor A
26,370× faster than Competitor B
Replicating the test
This test was performed with a mediocre software development desktop computer, not cherry-picked to favor LightningChart Python results. The results will vary depending on the computer setup used. The results reported give a good ball-park indication of huge performance difference between the libraries.
Conclusion
The test clearly indicates LightningChart Python significantly outperforms the other tested libraries in both streaming and static data visualization scenarios, with a significant difference. LightningChart is the fastest data visualization library for Python in the tests.
LightningChart’s remarkable rendering performance enables building demanding projects that haven’t been possible before: Interactive, instantly responsive, applications capable of smooth visualization of scientific, engineering, medical, seismic, vibration, sensor data, racing car telemetry, financial, industrial automation or digital signal processing data in real-time, just to name some.
LightningChart has pioneered GPU-accelerated data visualization technologies since 2007, and is now empowering next-generation Python projects with the super-performant LightningChart® technology.


Real-time tests
Static tests


If you have any questions, feel free to contact us!
©LightningChart Ltd 2025. All rights reserved.