The numpy.logspace() function is used to generate numbers that are evenly spaced on a logarithmic scale. Instead of creating values with equal linear differences, this function generates values that are evenly spaced according to powers of a base value.
Example: The following example demonstrates how to generate logarithmically spaced values using logspace().
import numpy as np
a = np.logspace(2, 3, num=5)
print(a)
Output
[ 100. 177.827941 316.22776602 562.34132519 1000. ]
Explanation:
- start=2 represents 102 and stop=3 represents 103
- num=5 generates five values between 102 and 103
- The values increase logarithmically, not linearly.
Syntax
numpy.logspace(start, stop, num=50, endpoint=True, base=10.0, dtype=None)
Parameters:
- start: Starting exponent of the sequence (base ** start).
- stop: Ending exponent of the sequence (base ** stop).
- num: Number of values to generate (default is 50).
- endpoint: Includes the stop value if True (default True).
- base: Base of the logarithm (default is 10).
- dtype: Data type of the output array.
Return Type: ndarray
Using Different Base Values
By default, logspace() uses base 10. This can be changed using the base parameter.
import numpy as np
b = np.logspace(2, 3, num=5, base=11)
print(b)
Output
[ 121. 220.36039471 401.31159963 730.8527479 1331. ]
Explanation:
- base=11 generates values as powers of 11 instead of 10.
- start=2 and stop=3 create values from 11² to 11³.
- num=5 specifies the total number of values.
Specifying Data Type
The output array can be converted to a specific data type using the dtype parameter.
import numpy as np
c = np.logspace(2, 3, num=5, dtype=int)
print(c)
Output
[ 100 177 316 562 1000]
Explanation: dtype=int converts float values to integers and decimal values are removed during conversion.
Visualizing logspace() Output
This example demonstrate how to visualize logarithmically spaced values using pylab for a better visualized understanding of their distribution.
import numpy as np
import pylab as p

x1 = np.logspace(0, 1, 10)
y1 = np.zeros(10)

x2 = np.logspace(0.1, 1.5, 12)
y2 = np.zeros(12)

p.plot(x1, y1 + 0.05, 'o')
p.plot(x2, y2, 'x')
p.xlim(-0.2, 18)
p.ylim(-0.5, 1)
p.show()
Output
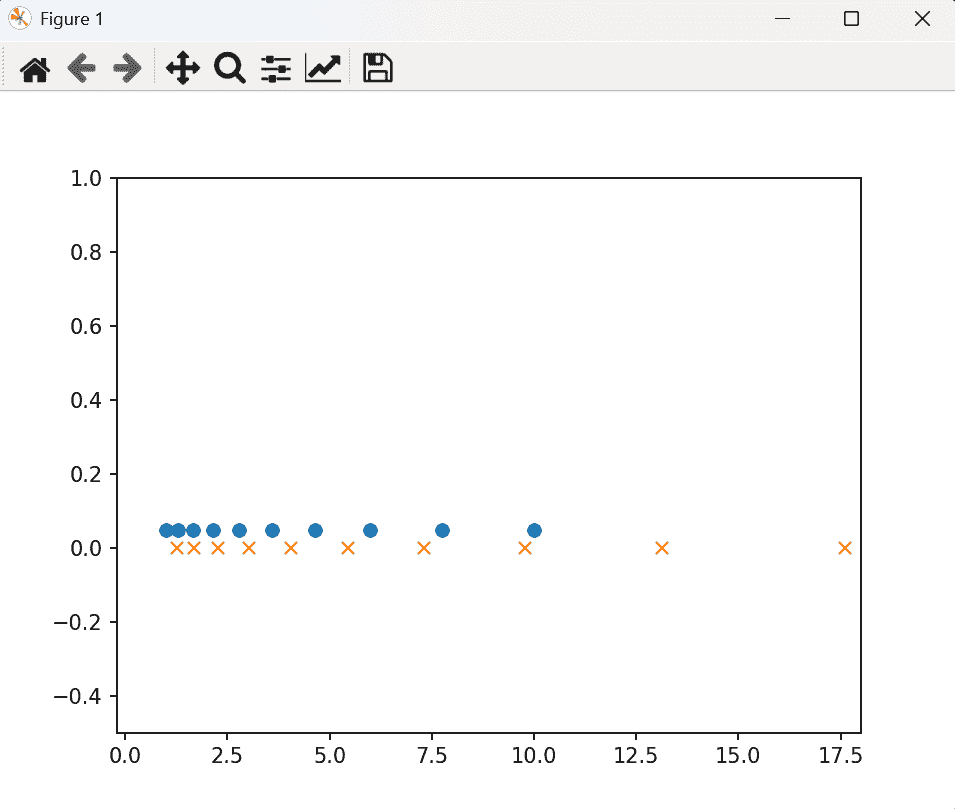
Explanation:
- np.logspace(0, 1, 10) creates 10 logarithmically spaced values between 10⁰ and 10¹.
- np.logspace(0.1, 1.5, 12) creates 12 values between 10⁰·¹ and 10¹·⁵.
- p.plot(x1, ..., 'o') and p.plot(x2, ..., 'x') plot these values using different markers.
- The increasing gaps between plotted points show the exponential growth of values produced by logspace().