CoreWeave's Default Risk Is Soaring. Should AI Traders Worry?The AI boom has a debt problem.
CoreWeave NASDAQ:CRWV has become one of the biggest beneficiaries of the artificial intelligence boom. Its customers want enormous amounts of computing power , its revenue is growing rapidly and its contracts stretch years into the future.
Yet Wall Street is sud
Where the world does markets
Join 100 million traders and investors taking the future into their own hands.
Get started for free$0 forever, no credit card needed

Supercharged
Supercharts

Core Weave Flirting with the $60 Flirting with the $60 markCoreWeave is an American cloud computing company that operates GPU-intensive AI infrastructure for training and running models, including large language models. The company was founded in 2017 in New Jersey under the name Atlantic Crypto, and later transitioned to cloud com
Higher yields bite NasdaqLast week's focus on data centres and AI infrastructure spending is a sign of what's coming for other tech stocks. Higher bond yields will start to impact the funding of many high growth ventures, particularly those who require short term liquidity to fund long term ambitions.
The gradual increase
Brazalian Real - A Real Opportunity Medium Term - Long RealShort term pop in dollar verses the Real is an opportunity. Few foreign currencies have the ability short and medium term to buck the trend of the dollar with higher US interest rates on the horizon. The Real is one of the most attractive right now. With Brazilian elections forecasting a roughly 80%
TSMC: Strong Earnings, AI Returns Under ScrutinyTSMC’s latest results support confidence in its business, but the shares need evidence that rapid capacity expansion can sustain attractive returns. At approximately $420.95 on the chart, the outlook is cautiously constructive, with near-term price weakness contrasting with strong reported earnings.
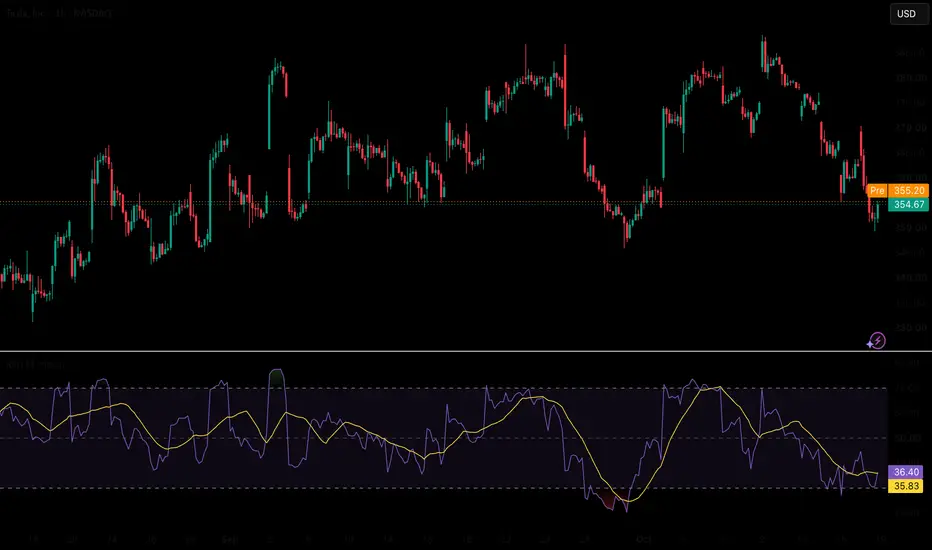
Tesla Is Up 20%+ Since July, But Down Y/Y. What Its Chart SaysTesla NASDAQ:TSLA has risen some 23% over the past roughly 2-1/2 months since hitting a 52-week low in July, but has nonetheless fallen about 15% over the past year. Let's check out the electric-vehicle giant's chart and fundamentals.
Tesla's Fundamental Analysis
Tesla plans to report Q3 resul
PYTH: buybacks strong, waiting for a pullbackPYTH powers a market-data oracle where more than 120 exchanges and trading firms publish prices directly. The business is growing fast: annual recurring revenue reached 11.5 million dollars in September, up 86% quarter over quarter. On October 8, a standing DAO rule took effect that sends 100% of th
USD/CHF Rises as SNB Stays Dovish and U.S. Dollar FirmsUSD/CHF stayed firm on Monday as geopolitical stress and another jump in energy prices drove demand back toward the U.S. Dollar. Brent pushed above $106 after fresh attacks in Saudi Arabia, keeping the inflation story alive ahead of Wednesday’s U.S. CPI report. Markets see only about a 19% chance of
Long-term value unlock in RNIRNI is trading very far below NAV and we think that there is a longer-term opportunity for a value unlock here.
The stock sold off on the back of a disposal and the large amount of cash on the balance sheet. The market is waiting to see what the company intends to do with all that cash, and thus fa
ADOBE (Photoshop & Illustrator): A New Technical Era (2026)I named the title "ADOBE (Photoshop & Illustrator): A New Technical Era (2026)" because we have multiple confluences on multiple timeframes occurring synonymously.
Monthly:
Long-term diagonal TL from 1987, hit multiple times. Now the price has given signs of life at that TL in 2026.
A-B-C complet
See all editors' picks ideas
Market Matrix (Zeiierman)█ Overview
Market Matrix (Zeiierman) is a multi-timeframe market analysis dashboard that brings together price structure, trend, momentum, and market strength into six compact indicator panels.
Instead of switching between multiple indicators and timeframes, Market Matrix displays higher-timefr
RedK Indicator Amplifier (RedK i-Amp)🟩 What is RedK i-Amp?
-------------------------------
RedK i-Amp is not an indicator in itself - it's a "wrapper" utility that "amplifies" another "source" indicator by improving its visual and alerting capabilities.
RedK i-Amp hooks to another indicator's plot and enables the addition of the fol
TASC 2026.10 A Low-Risk ETF-Trading Strategy█ OVERVIEW
This script implements concepts from a short-term ETF investment strategy outlined by Markos Katsanos in the article "Selecting Strong ETFs While Avoiding Sharp Overbought Reversals" from the October 2026 edition of TASC Traders' Tips . The strategy analyzes Katsanos' custom relative s
Buyers & Sellers Profile + Dynamic S/R (Zeiierman)█ Overview
Buyers & Sellers Profile + Dynamic S/R (Zeiierman) is a volume-profile and market-structure indicator designed to combine a large rolling Buyers/Sellers Volume Profile with dynamically generated support and resistance levels.
Instead of treating the volume profile and swing structure
Vol-Control Fund PositioningThe investors who sell because nothing happened
In 2017 the American stock market was so calm that a whole class of institutional portfolios held more equities than their own capital, simply because the rules they follow told them to. Reconstructed with the model behind this indicator, their estim
RedK Multi-Modal TrailingStop (RedK MMTStop)█ RedK MMTStop - Release Notes
Introduction & background
RedK MMTStop is a Multi-Modal Trailing Stop indicator - Let's quickly explore the "trailing stop" concept first as a refresher - then explain what a multi-modal trailing stop indicator does.
A "Trailing Stop" is what helps traders avoi
Trend Target Ribbon [BOSWaves]Trend Target Ribbon - ALMA Conviction Trend Detection with Integrated Structure-Based Position Planning and R-Multiple Target Tracking
Overview
Trend Target Ribbon is an ALMA-based trend identification system that combines slope-normalized momentum confirmation with standard deviation band
Wyckoff [theUltimator5]This indicator was designed to be a comprehensive, intuitive, overly engineered algorithm that plots Wyckoff accumulation and distribution patterns on the chart as they arise. It shows the current status of the regime on a side panel, while also overlaying the accumulation or distribution schematic
XeL OnlineRecursionXeL OnlineRecursion is a Pine Script library for online and streaming statistical estimation on continuous numerical and financial data.
The library is designed around recursive statistical populations whose retained state is updated observation by observation. Most recursive components use consta
Dual-Phase Reversal by DGTDual-Phase Reversal • Exhaustion, Pivots & Pressure
Dual-Phase Reversal (DPR) is a two-phase market exhaustion framework that tracks directional momentum through Momentum Exhaustion and Terminal Exhaustion . It combines sequential price conditions, Momentum Shift initiation, phase qualificatio
See all indicators and strategies
Community trends
CoreWeave's Default Risk Is Soaring. Should AI Traders Worry?The AI boom has a debt problem.
CoreWeave NASDAQ:CRWV has become one of the biggest beneficiaries of the artificial intelligence boom. Its customers want enormous amounts of computing power , its revenue is growing rapidly and its contracts stretch years into the future.
Yet Wall Street is sud
AMD | Flip Zone Decides, Two Pools AboveBy analyzing the #AMD (Advanced Micro Devices) chart on the 4H timeframe, we can see a market that corrected, rebuilt its structure from the ground up, expanded to a new high, and has now handed the entire move back to the zone that started it.
━━━━━━━━━━━━━━━━━━━━
4H TIMEFRAME
━━━━━━━━━━━━━━━
MELI ChartThe future of MELI.
Likely that we see a drop from where we are now toward $1,650 to try and prove support alongside HTF trendline and previous liquidity reaction.
With a failure to hold there, I will look for a short opportunity to $1,350.
Either way, there will be a very interesting tradable set
NUCL - One Breakout Away From a Bullish Reversal! NUCL continues to trade under bearish pressure, but price is now approaching a critical technical area that could determine its next major move.
With the $5 weekly support and round number being tested once again, the question is whether buyers can regain control and potentially trigger a new bul
GTLB Monthly: Falling Wedge Breakout + Bullish RSI DivergenceGitLab has broken out of a multi-year falling wedge on the monthly chart, and a bullish RSI divergence supports the shift in momentum. The measured-move projection points to ~$99.
THE SETUP
1. Falling wedge (late 2021 – 2026)
Since the ~$137 all-time high in late 2021, GTLB has traded inside a f
ORCL: July 28 Low Completes ABC, Early Impulse Opens Path to $32ORCL: July 28 Low Completes ABC, Early Impulse Opens Path to $329
Elliott Wave
Weekly impulse from 2020 lows completed Wave 5 on September 10, 2025 at $323.43. The decline that followed is a finished Intermediate ABC. Daily confirms Wave (A) into early 2026, Wave (B) into mid-2026, and Wave (C)
MU Analysis: Rising Trendline Breakdown Signals Bearish Pressure🔹 MU is showing a bearish shift in price action after breaking below the rising trendline that had supported the previous bullish market structure. Price faced repeated rejection near the 1,000–1,030 resistance zone before sellers pushed it lower, weakening the recovery structure. The latest candles
Leaning on Institutions as Retail Revenue Falls 31%!Coinbase (NASDAQ: COIN) is increasingly positioning itself as infrastructure for moving money rather than merely a place to trade bitcoin, and a modest deal late last week illustrated the ambition. Marqeta said it is expanding its work with Coinbase so that businesses can offer cards funded by stabl
Tesla Tests $352.84 Range Floor as Volatility SurgesKey Highlights
Tesla closed at $354.72 on October 16, down 2.13% for the day and 7.31% for the week after a five-session losing streak.
Friday's $21.17 trading range from $370.50 to $349.33 equaled about 5.97% of the closing price and was the widest of the past 50 sessions.
Trading volume reac
Core Weave Flirting with the $60 Flirting with the $60 markCoreWeave is an American cloud computing company that operates GPU-intensive AI infrastructure for training and running models, including large language models. The company was founded in 2017 in New Jersey under the name Atlantic Crypto, and later transitioned to cloud com
See all stocks ideas
Oct 19
VFSVinFast Auto Ltd.
Actual
−0.42
USD
Estimate
−0.26
USD
Today
PEBOPeoples Bancorp Inc.
Actual
1.12
USD
Estimate
0.93
USD
Today
SYFSynchrony Financial
Actual
2.68
USD
Estimate
2.42
USD
Today
EFXEquifax, Inc.
Actual
2.26
USD
Estimate
2.20
USD
Today
MMM3M Company
Actual
2.50
USD
Estimate
2.38
USD
Today
HASHasbro, Inc.
Actual
2.90
USD
Estimate
1.86
USD
Today
GMGeneral Motors Company
Actual
3.70
USD
Estimate
3.69
USD
Today
KEYKeyCorp
Actual
0.51
USD
Estimate
0.46
USD
See more events
Community trends
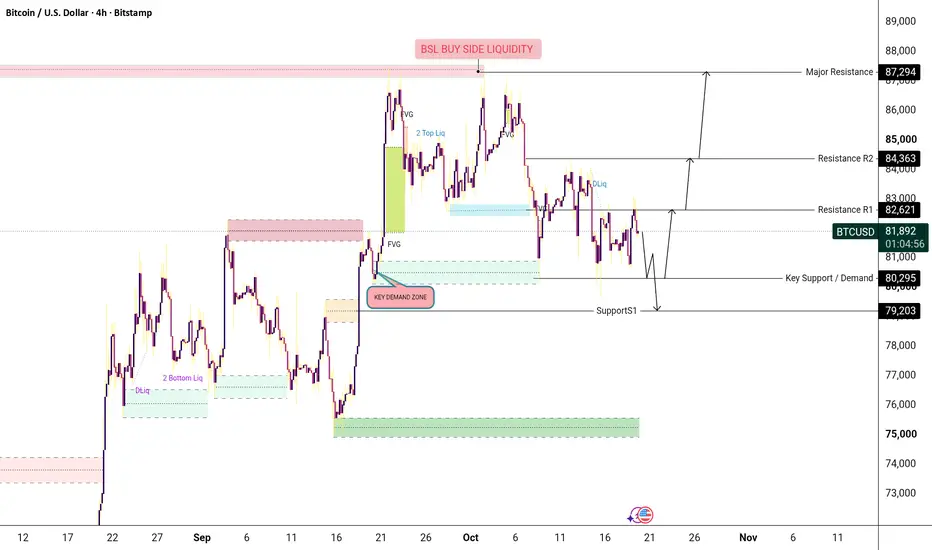
Bitcoin (Btcusd)—Bullish Trendline & Key Decision ZoneBelow is a professional candle-by-candle reading of the visible structure. The exact OHLC of every candle is not readable from the screenshot, so the explanation is based on each visible candle’s body, wick, rejection, displacement, and relationship with the previous candle.
1. Initial bearish cand
BTCUSDT – Bearish Breakdown & Downside Continuation Setup📊 BTCUSDT – Bearish Breakdown & Downside Continuation Setup
🔍 Market Overview
Bitcoin is currently trading around 82,640 on the 12H timeframe after losing its ascending trendline support. Following a strong upward move, price faced repeated rejection near the 86,000–87,500 resistance zone and has
BITCOIN Will it complete an Inverse Head and Shoulders again?Bitcoin (BTCUSD) has been following so far very closely the late 2022 - early 2023 Cycle bottoming process, which was an Inverse Head and Shoulders (IH&S) pattern that transitioned the market from the Bear to the Bull Cycle.
This time it appears that the 1W MA100 (green trend-line) is working as th
BTCUSD: Evaluating a Potential Bullish Market Structure Shift.
The current BTCUSD chart highlights a potential bullish recovery following a strong downside move into the lower demand area. Price is showing signs of short-term strength, with recent bullish price action and a Change of Character (CHoCH) suggesting a possible shift in market structure. However, f
BTCUSD 4H Analysis | SMC, Buy-Side Liquidity, Supply & Demand,
BTCUSD 4H Market Analysis | Smart Money Concepts, Buy-Side Liquidity, Supply & Demand, Support & Resistance
1. Market Overview
This BTCUSD 4-hour chart presents a technical analysis of Bitcoin using Smart Money Concepts (SMC), Buy-Side Liquidity (BSL), supply and demand zones, Fair Value Gaps (
Bullish Reversal Setup: Potential Rally Toward $2,600ETHUSD is trading around $2,393, following a strong bearish move. Price is approaching the $2,360–$2,380 support zone, with a deeper demand zone around $2,320–$2,330. The chart shows a bullish recovery attempt after a previous CHoCH and BOS, but the Supertrend remains bearish near $2,435. Buyers nee
BTCUSD 1H Market Analysis | Bearish Continuation SetupBitcoin is showing bearish price action on the 1-hour timeframe. After reaching the 84,061 resistance area, price experienced strong selling pressure and started moving lower. The previous upward move was followed by a bearish shift in market structure, suggesting that sellers may still be in contro
Bitcoin Consolidation bullish continually Upside Bitcoin is currently trading around 82,080, showing consolidation after a recent decline from the 85,000 / 87,000 area and Price suggests that sellers have maintained pressure, while buyers are attempting to defend the 80,000 / 81,000 support zone.
Tecnically price facing rejection near previous hi
BTCUSD Analysis | Bearish Order Block, FVG & Liquidity SweepüThis analysis focuses on the current BTCUSD price structure using Smart Money Concepts (SMC), with particular attention to liquidity sweeps, Break of Structure (BOS), Change of Character (CHoCH), Fair Value Gaps (FVGs), and order-block reactions.
Price has shown repeated structural shifts, followed
Reject 84K and BTC drops toward 76.3KBTC looks ready to load up for a Monday push straight into the supply zone, and that is exactly where we want to be short.
🟠 Why This Level Matters
The 83,650 – 84,000 zone has already capped price multiple times this month. A push into it on Monday hands us a clean rejection area before the nex
See all crypto ideas
GOLD Price Update – Clean & Clear ExplanationGold is currently trading around 4165, showing signs of hesitation after a recent recovery from lower levels the current structure suggests that bullish momentum may be weakening as price struggles to break above the descending trendline and critical supply zone.
Technically Price coverage 4190–422
Gold 30Min Engaged ( Bearish Reversal Detected )HANZO MARKET LIQUIDITY REPORT
Gold
Timeframe: 30min (Volume Basis)
Scale: Higher Timeframe Context / Deep Volume analysis
━━━━━━━━━━━━━━━━━━━━━━
Market Observation
This analysis is focusing on structural behavior, liquidity zones, Volume analysis
and key areas of interest within the current range.
GOLD 1D Market Structure Liquidity Zones & Price Action AnalysisGOLD 1D | Market Structure, Liquidity Zones & Price Action Analysis
Detailed Chart Explanation — Candle-by-Candle Reasons
This GOLD (XAUUSD) daily chart explains how price reacts to major resistance, demand zones, liquidity levels, Fair Value Gaps (FVG), Order Blocks (OB), and market structure. Ea
GOLD - A short squeeze could trigger a declineIC:XAUUSD on Friday attempted to strengthen within a strong downtrend supported by an unstable fundamental backdrop. However, the rise was stopped...
The correction in the market began after Warsh's remarks about uncertainty regarding his actions, which was interpreted as a signal for a pause
XAUUSD /GOLDGold is currently trading around 4165, facing selling pressure after rejection from the near-term resistance zone at 4182–4190. Price is consolidating near immediate support, and the next move may depend on whether buyers can defend this area or sellers gain further momentum.
🔑 KEY RESISTANCE ZONES
GOLD 2H: Support Rebound Challenges Descending TrendlineGOLD 2H: Support Rebound Challenges Descending Trendline
Gold is recovering from the 4,100–4,120 support zone, with buyers pushing price toward the descending trendline. A confirmed breakout above trendline resistance could strengthen bullish momentum and open the way toward the marked resistance z
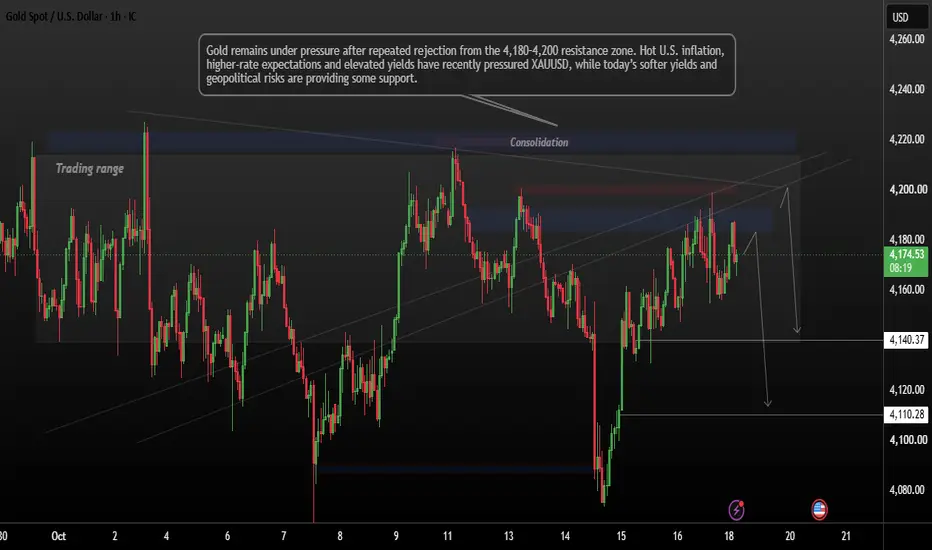
GOLD Consolidation Downside Pressure Builds below 4,200 Gold is showing repeated rejection from the 4,180–4,200 resistance area, keeping the short-term structure vulnerable to another downside move.
Fundamentally, the recent hot U.S. inflation data strengthened expectations for a more hawkish Federal Reserve, while higher U.S. yields and periods of USD
Gold Faces a Reality Check After Another Rejection at 4,200$Hello traders! Here’s my technical outlook based on the current XAUUSD (1H) chart structure. XAUUSD previously started to decline under the Trend Line and formed a range near the Seller Zone. Price then tested the Resistance Level with breakouts and was rejected. Currently, XAUUSD is trading below t
XAUUSD 1D | Institutional Liquidity Mapping & Bearish Repricing XAUUSD 1D | Institutional Liquidity Mapping & Bearish Repricing Framework
Gold on the Daily timeframe is currently trading around the 4,165 area, with price consolidating inside a lower-value region after a strong rejection from the September highs. The overall structure shows a clear sequence of p
XAUUSD H1: Gold's Rising Channel Could Be a Bull TrapWhat if the recent recovery in Gold is actually setting up the next move lower?
Gold is currently trading around 4,180, and at first glance, buyers seem to be doing a decent job. Price has recovered sharply from the 4,080 area and is now moving inside a rising channel.
But there is something I don
See all futures ideas
EURUSD 4H | ICT Liquidity Sweep, MSS & BOSEURUSD 4H Analysis | ICT/SMC, Liquidity and Market Structure
1. Market Context and Higher-Timeframe Bias
EURUSD remains within a broader bearish structure on the chart, characterized by persistent downside movement and a sequence of lower highs and lower lows. The latest recovery from the region a
EUR/USD - Bullish Channel Pattern (19.10.2026)Setup Overview:
EUR/USD pair on the 30-minute timeframe presents a clear buying opportunity following a well-defined bullish channel pattern. The market printed a sharp rejection from the support zone, confirming that buyers have regained control and strength is building to push price higher.
📊
EURUSD Sellers Push Back as the Descending Structure PersistsHello traders! Here’s my technical outlook based on the current EURUSD (4H) chart structure. EURUSD previously started to decline under the Resistance Line after breaking from higher levels and formed a descending structure. Price then tested the Seller Zone with breakouts and was rejected. Currentl
EURUSD – Buyers Are Beginning to Take ControlEURUSD is showing an interesting shift as the technical picture turns increasingly bullish despite a still-mixed fundamental backdrop . Political uncertainty in France and a relatively firm U.S. dollar continue to weigh on the euro, but price is no longer behaving as weakly as those headlines might
EURUSD: Descending Trendline Resistance Bearish Channel in Focus🔹 EURUSD continues to trade within a descending channel, reflecting a bearish market structure with persistent lower highs and lower lows. Recent price action shows a short-term recovery toward the upper channel boundary, followed by rejection near the 1.1230–1.1260 area. The highlighted support zon
EURUSD4H Analysis SMC Supply Demand Liquidity, FVG Reversl setup
EURUSD 4H Market Analysis | Smart Money Concepts, Supply & Demand, Liquidity, FVG and Potential Reversal
Market Overview
This EURUSD 4-hour chart presents a detailed technical analysis using Smart Money Concepts (SMC), supply and demand zones, Fair Value Gaps (FVGs), liquidity levels, bearish t
AUDUSD is Nearing a Strong Resistance Area!Hey Traders, in today's trading session we are monitoring AUDUSD for a selling opportunity around 0.70000 zone, AUDUSD is trading in a downtrend and currently is in a correction phase in which it is approaching the trend at 0.70000 support and resistance area.
Trade safe, Joe.
EURUSD | Bullish Breakout & Bullish Continuation Setup# EURUSD | Bullish Breakout & Bullish Continuation Setup
### Fundamental View
EURUSD is attempting a bullish recovery following its recent decline, supported by a pullback in the US dollar and easing US Treasury yields. On October 15, the dollar retreated from its recent highs as Treasury yields f
EURUSD On a Bullish RecoveryEURUSD On a Bullish Recovery
From our previous analysis, the EURUSD price reached the first target. The current picture is very complex overall because we are still in a larger corrective wave.
However, this could be the time when EURUSD could make the first attempt to rise further.
EURUSD could
USDJPY Bullish Breakout – Target near resistance zone USDJPY is showing strong bullish momentum on the 1-hour chart after consolidating inside a support zone around **157.65–158.25**. Buyers have stepped in, pushing the price upward and breaking above the recent consolidation range.
The current price is near **158.546**, and if bullish momentum contin
See all forex ideas
Trade directly on Supercharts through our supported, fully-verified, and user-reviewed brokers.