-
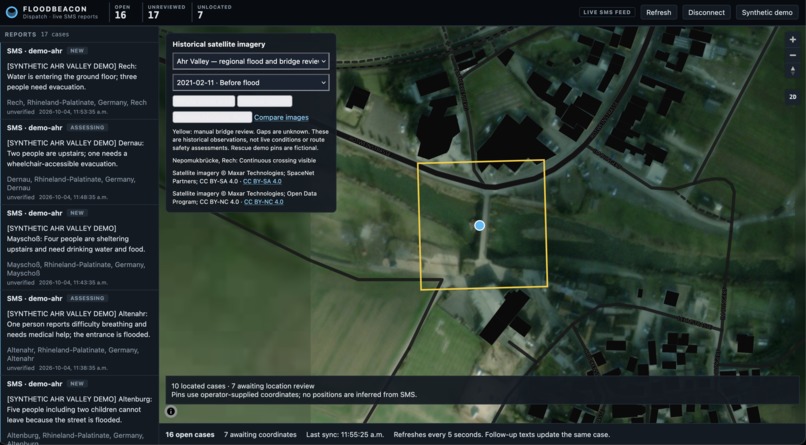
Before flood
-
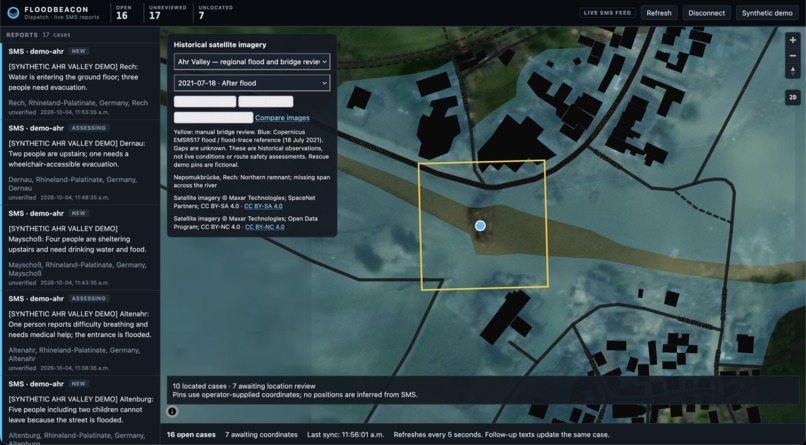
After flood
-
-


Inspiration
During a flood, satellite images show where water has spread, while messages from affected people explain who needs help. Inspired by ALEASAT’s disaster-relief mission, we created FloodBeacon to bring these sources together and help responders assess affected communities. We also compared before-and-after satellite images to identify visible bridge damage, highlighting how disrupted crossings can affect access to help.
What it does
FloodBeacon brings satellite imagery and requests for help into one responder dashboard. Before-and-after satellite images highlight bridge damage and potential access disruptions.
Our SMS service receives messages through Twilio and uses Gemini to extract location, number of people, hazards, and assistance needs. It asks for missing address details and accepts “unknown.” Original messages remain available for review, while responders control verification, priority, and response status.
Methodology and Data-sourcing
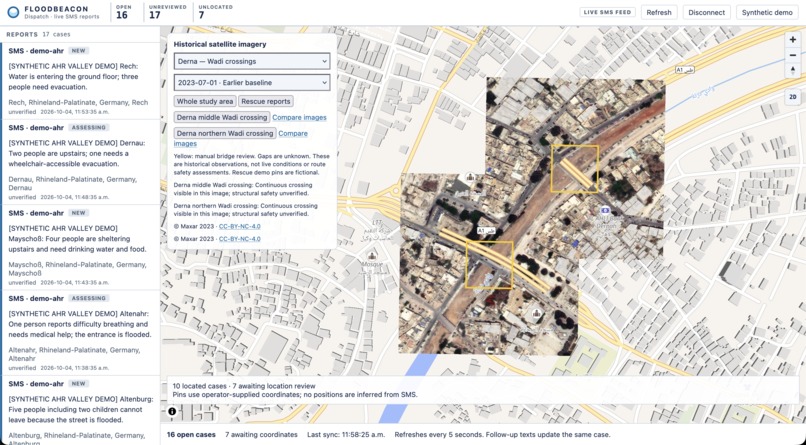
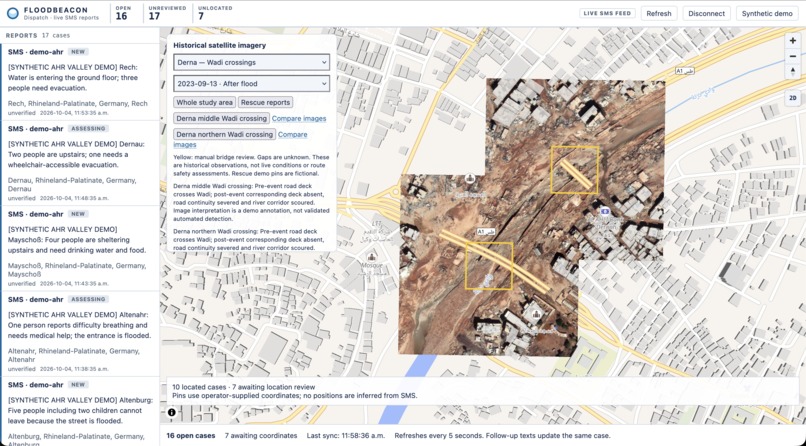
We crop and align dated satellite images, compare bridge crossings before and after floods, and display location-linked findings on the map. The backend provides regional imagery, bridge close-ups, and comparison images.
| Area | Imagery source | Dates used |
|---|---|---|
| Ahr Valley / Rech, Germany | Maxar imagery through SpaceNet 8 for bridge close-ups and Maxar Open Data for regional coverage | February 11 and July 18, 2021 |
| Derna, Libya | GeoEye-1 imagery from Maxar Open Data | July 1 and September 13, 2023 |
| Syabrubesi, Nepal | High-resolution imagery from Vantor Open Data | September 17, 2023 and August 27, 2026 |
| Syabrubesi, Nepal | Planet Crisis Response PlanetScope imagery providing an additional road-crossing reference | May 27, 2026 |
We also reference Copernicus flood maps and UNOSAT damage assessments to provide context for the satellite comparisons.
How we built it
We built the SMS intake service in Python using FastAPI, Twilio, Gemini, and Pydantic. Twilio sends messages to a signature-validated webhook. A background worker uses Gemini to extract structured information, validates the JSON, and queues location follow-up questions. The backend preserves messages, extraction versions, incident updates, and an audit history. The API provides message reports and a GeoJSON feed for incidents with reviewed coordinates.
For the satellite component, we used Rasterio to crop and align Maxar, Vantor, and Planet imagery into georeferenced map overlays and before-and-after comparisons. Multimodal LLM create bridge annotations, while Copernicus and UNOSAT supplied separate agency context. FastAPI serves the prepared imagery, and PostgreSQL stores observation metadata and geographic annotations. Processing happens before publication, keeping map requests lightweight.
Challenges we ran into
Connecting the messaging pipeline required coordinating the public webhook, API server, worker, and database. Receipt logs and worker updates helped us locate failures.
Gemini integration required troubleshooting schema compatibility and model availability. We verified the extraction workflow with an alternative model after repeated failures.
Finding a suitable pretrained model for bridge damage detection was difficult. We instead used a multimodal LLM to compare before-and-after satellite images and flag visible bridge changes.
Representing uncertainty was another challenge. Missing addresses do not mean nobody needs help, and reported flooded roads are not confirmed closures. We preserve these distinctions and keep AI image findings separate from agency assessments.
Accomplishments that we're proud of
We built a working SMS service that turns requests for help into structured reports, asks follow-up questions for missing addresses, and preserves the original messages for review.
We also used multimodal AI to identify visible bridge destruction in before-and-after satellite images from Germany, Libya, and Nepal, bringing the comparisons onto an interactive map.
What we learned
- How to find and combine satellite imagery from different providers for before-and-after comparisons.
- How multimodal AI can help identify visible bridge damage when suitable pretrained models are difficult to find.
- How conversational SMS can turn incomplete requests for help into useful information for responders.
What's next for FloodBeacon
- Connect the latest satellite imagery, weather, river gauges, and field reports to support deployment during active disasters.
- Add offline access to maps and reports, with periodic syncing when connectivity returns.
- Expand damage assessment beyond bridges to roads, buildings, and other critical infrastructure, giving responders a broader picture of affected areas and access disruptions.
- Before any real operational use, we would work with emergency-response professionals to evaluate accuracy, usability, and how FloodBeacon could support their existing procedures.


Log in or sign up for Devpost to join the conversation.