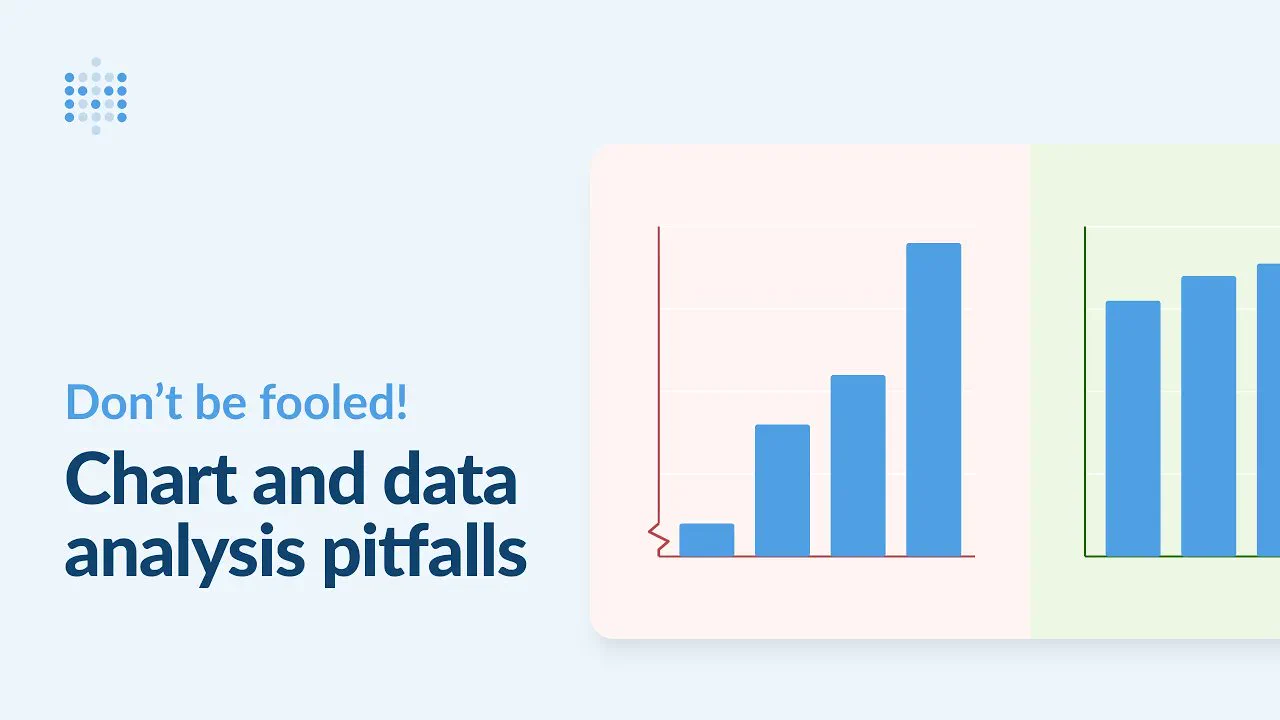
Six ways charts and data quietly mislead you, most of them by accident:
• Implied causation
• Meaningless crossing lines
• The cropped y-axis
• Broken baselines
• Same average, different story
• Simpson's paradox
Full house in NYC 🗽 tonight!
300 analysts, data engineers, and AI builders from across the city registered for data, dashboards, and drinks at @datadoghq.