
New
Charts and reports now get smart, auto-generated titles and descriptions based on your query. May your spaces stay clean and typo-free!
Charts and reports now get smart, auto-generated titles and descriptions based on your query. May your spaces stay clean and typo-free!

Dark mode has landed at Lightdash! Switch between light and dark themes anytime with the new toggle in the navbar. Your preference is saved automatically and personalized to you, so your teammates can use their favorite theme independently.
We've also introduced custom color palettes for dark mode, so admins can extend their brand palettes to look perfect in both light and dark themes. You can read more about this in our docs.
Introduced in version 0.2246.0

Embed standalone Lightdash charts directly in your product! While embedded Dashboards provide a large overview of datasets for your customers, embedding a single chart lets you surgically add metrics and data to your React application.
You can enable Charts in your embed settings (the same place you enable Dashboards to embed). The JWT setup is similar to configuring an embedded Dashboard:
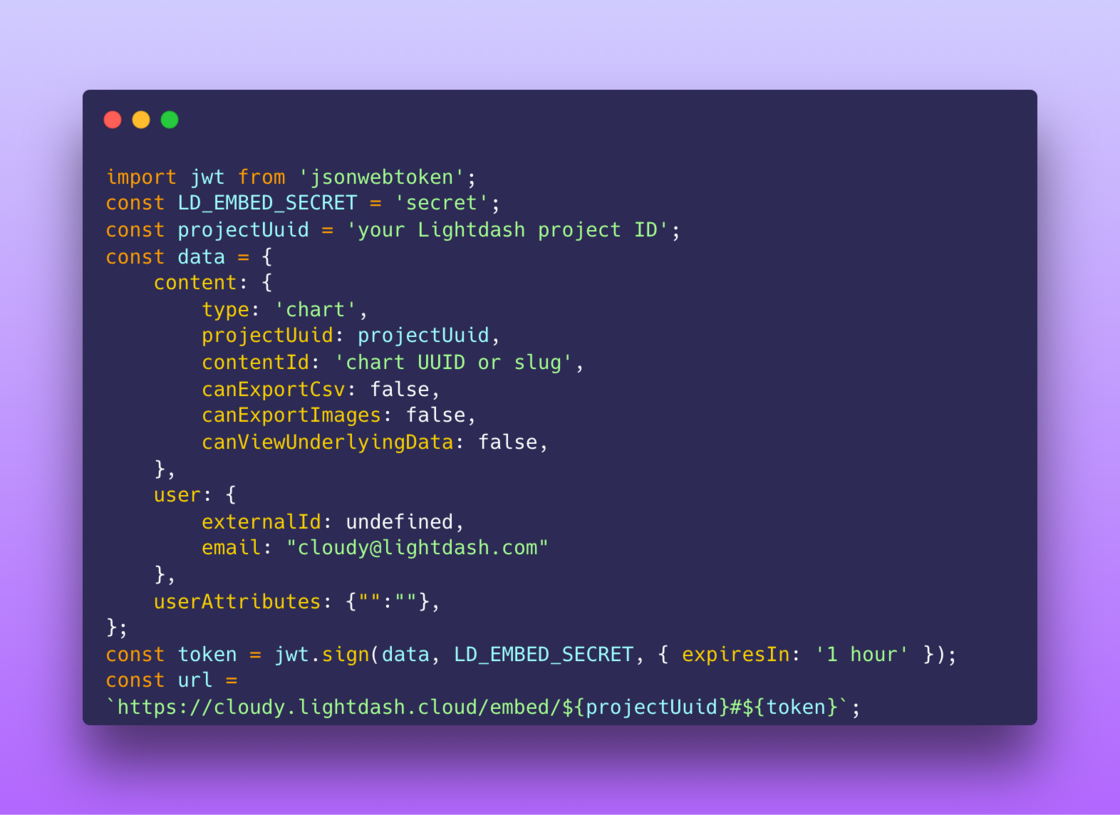
Embedded Charts are only available via the React SDK right now. Let us know if you're interested in embedding charts via the iframe.
You can read more about embedding Charts in our docs.
Introduced in version 0.2167.0

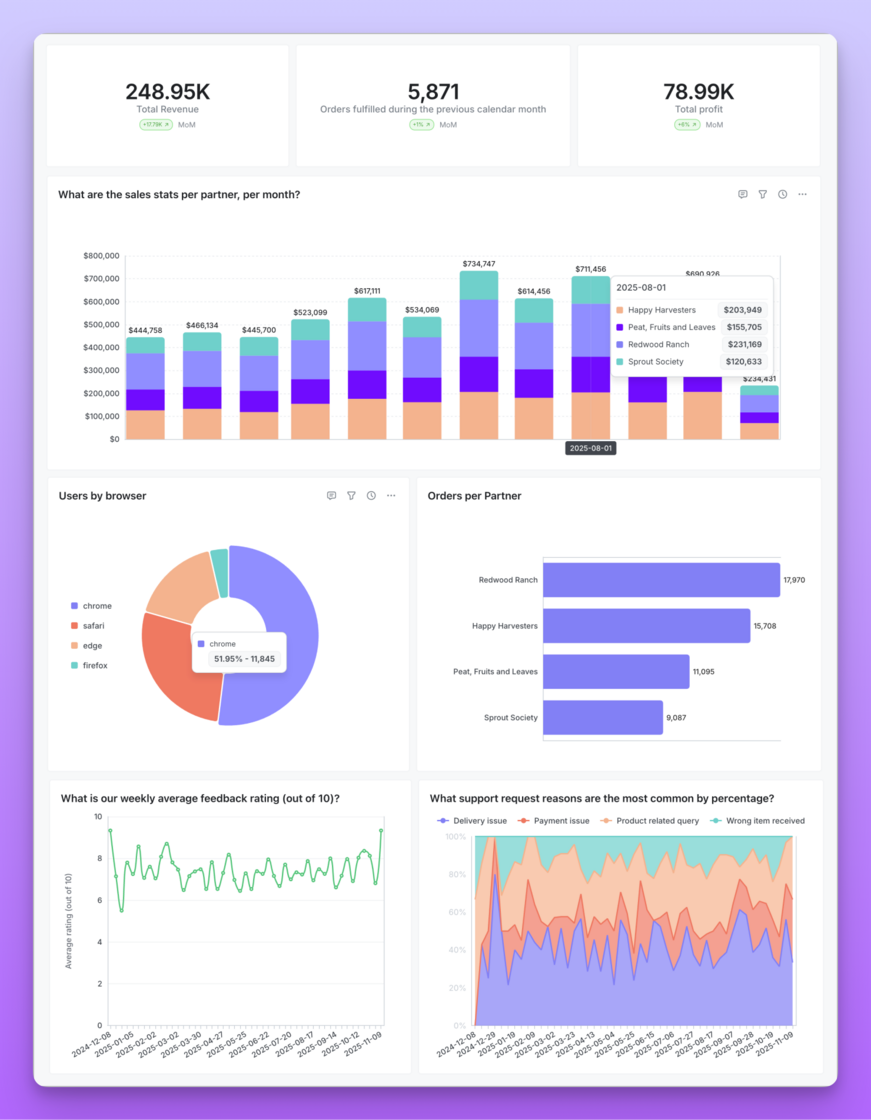
Show KPIs and metrics at-a-glance with our new Gauge chart visualization! Perfect for dashboards where you need instant visual feedback on performance against targets.
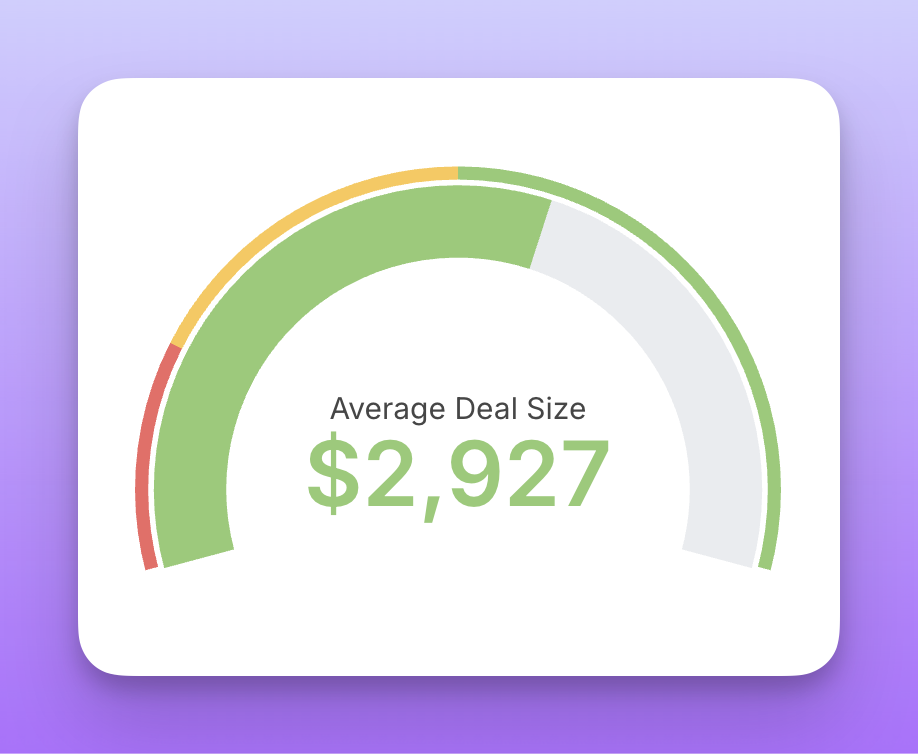
Find the new Gauge option in your chart type dropdown when configuring visualizations. Read more about this feature in our docs.
Introduced in version 0.2181.0

You can now display images directly in table cells! Instead of seeing raw URLs, your tables can show actual image thumbnails that expand on hover.
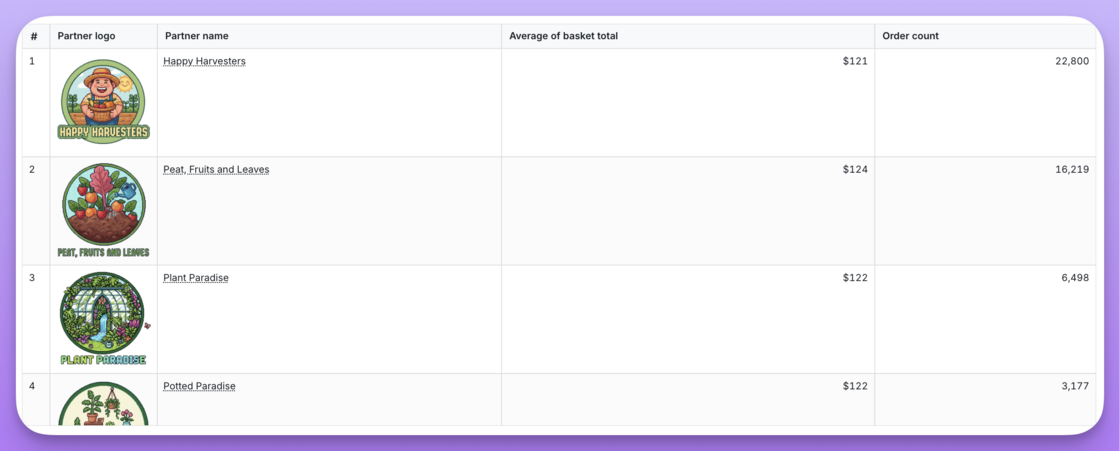
Perfect for product catalogs, user profiles, or any data where seeing the image matters. Just add an image property to your dimension and point it to your image URLs. Find more about this feature on our docs
Introduced in version 0.2177.1

We've shipped a series of visual improvements to the current charts and dashboards to make them look and feel more modern.
Track every change to your Lightdash project with the new Compilation History page. Now you can see a complete log of all dbt compilations, including both CLI deploys and UI refreshes.
Each compilation entry shows you when it happened, who triggered it and extra metadata about that compilation.
Perfect for auditing changes, debugging issues or understanding how your project has evolved over time.
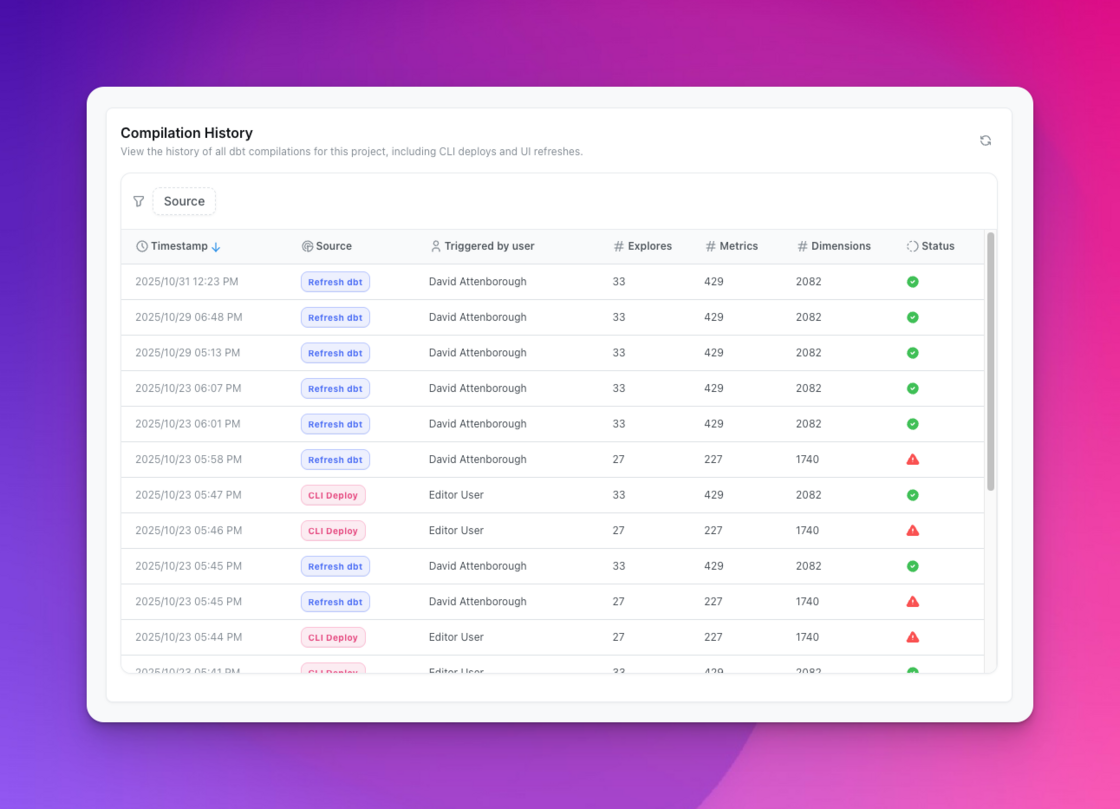
You can find this under Project Settings > Compilation History or read more in our docs.
Introduced in version 0.2117.0 (2025-10-29)
You can now toggle on 100% stacking in your bar and area chart configurations to automatically show relative distributions instead of absolute values with a new stacking option in the UI, without having to rely on table calculations.
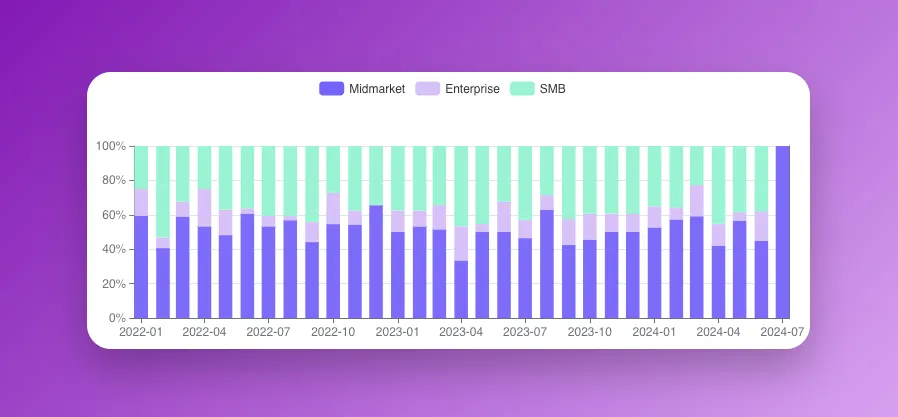
Perfect for tracking how your metric composition changes over time or across different groups.
You can find more about this feature on our docs
Introduced in version 0.2086.2
Two improvements for Showing Underlying Data!
We’ve been able to view underlying data on charts for some time. Until now, we’ve only been able to view underlying dimensions. Now, we’re able to include metrics when a user clicks View Underlying Data.
Using show_underlying_values on your dbt model, simply include any metrics from your model, and it will be added to underlying table we show. This is an opt-in feature. By default we will only show dimensions.
📚 Check out the show underlying values docs for more information.
Introduced in version 0.2072.0
Sometimes when defining a model, we end up declaring the same field names over and over. You might have even done this when defining show_underlying_values.
Now, you can declare a set of fields within your model’s meta tag. A set allows you to store a reference to those fields that are used multiple times in your model.
# Define a set
sets:
  my_set:
    fields:
      - user_id
      - user_name
      - created_at

# Referencing the set
fields: [my_set*]

# Lightdash resolves to
fields: [user_id, user_name, created_at]
📚 Read the sets documentation to learn more.
Introduced in version 0.2089.1
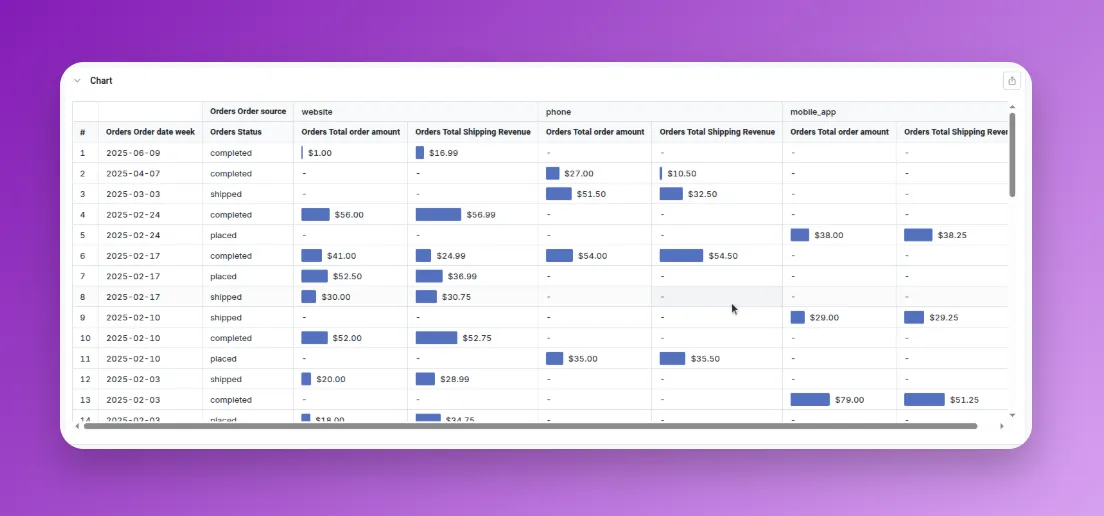
Tables just got more visual! Add tiny bars to numeric columns to make data comparison easier at a glance.
Head to Bar display in the sidebar, select your numeric columns, and we'll automatically add scaled bars next to each value. Perfect for spotting trends and comparing values instantly.
You can find more about this feature on our docs
Introduced in version 0.2082.0