12 years on the mountain: How the questions have changed (but the math hasn’t)

In the world of experimentation, if you find a ‘winning variation’, you iterate (and improve). This is why Conductrics is heading back to Superweek for the 12th time in 2026. We began in 2015 as attendees and became a proud sponsor along the way. We return for more than the content; we return because it offers a rare environment where we can pause, put down our defenses, and truly listen to one another. It’s a space that prioritizes connection over transactions – where titles drop away, and honest debate happens as often by the bonfire as it does on stage. 

What we’ve presented during our years at the conference has also evolved. In this post, we’re going on a small journey back in time to see how the conversation in the data industry shifted over the last decade. Join us – we’ll get you immersed in the Superweek atmosphere and industry secrets in no time!

The evolution of the conversation

If you look back at the agendas over the last decade, you can see the entire history of our industry written in the talk titles. Conductrics was there every step of the way, often providing scientific guardrails for emerging trends. 

Building the foundation (2015-2017)

This was the time for mastering the how – discussing the tools, the possibilities for collecting data, and defining the strategy. Simo Ahava empowered analysts to take control of their data pipelines, encouraging them to think outside the box when using GA and GTM to collect it. Avinash Kaushik provided them with the strategic framework (like See-Think-Do-Care) to give that data purpose. 

With that strong foundation already in place, Conductrics’ role was to help make the right decisions. Once you have a way to collect information and a clear objective in mind, how do you ensure you choose the best path to do it?


Image
Matt Gershoff, Conductrics CEO, giving his talk on “Decision Making at Scale: Blending A/B Testing, Predictive Analytics, and Behavioral Targeting” at Superweek in 2015

In our first session, we discussed how machine learning can help automate decision-making at scale. By 2017, we were introducing Reinforcement Learning to solve multi-touch problems. AI was just beginning to enter mainstream conversation at the time, primarily through news about DeepMind’s AlphaGo beating the world’s top Go players. Superweek has always been the place to discover and discuss the future of analytics. 

Image
One of the introductory slides from Matt Gershoff’s 2017 Superweek presentation on Reinforcement Learning

Navigating complexity (2018-2020)

These next few years included discussions on how to be more intentional in applying analytic theory. Charles Farina’s “Let’s actually use analytics to do something” and Mariia Bocheva’s “Website analytics: the missing manual” were just a few examples of experts encouraging people not to be afraid and take action on their data. 

Machine learning became more mainstream as well – in 2018 alone, seven different presentations touched on this subject. Jim Sterne was instrumental in helping marketers understand that AI wasn’t sci-fi, but an important part of their future toolkit. 

Conductrics’ own Matt Gershoff knew that for this future to work, businesses would need to trust ML before incorporating it into decision-making. Because trust requires understanding, and interpretability is the key to it, it became the theme of his presentation. In addition, interpretability was pivotal in ensuring compliance with the GDPR as it entered into force. You could feel the industry was still debating how to adopt these complex tools, which were not fully transparent nor easy to understand, while complying with the new privacy laws. 

We continued to demystify this complexity in 2019 with a talk on Entropy and its use in analytics and data science. We capped off this era in 2020 with “Multi–armed bandits: Going beyond A/B testing”, demonstrating that sophisticated methods can be practical, accessible tools for optimization. 


Image
Superweek Analytics Summit, 2018

2021 – what a year!

A lot could be said about the 2021 Superweek edition, but there is one thing that’s more important than anything – Fred Pike’s banana bread. Fred, if you’re reading this, we need that recipe.

Engineering for integrity (2022 – 2025)

The Superweeks of the first half of the 2020s focused on balancing the benefits of collecting data and information about customers and their behavior with the need for responsible, privacy-compliant practices. Experts like Aurélie Pols (who spent years warning us about privacy risks and the importance of data ethics) and Karolina Wrzask (who advocated for data minimization in her ‘We don’t need all your data. Neither do you.’ talk) were at the forefront of this change. 

And once again, Conductrics was right there to lead and support, providing engineering answers to these ethical questions.

In 2022, we tackled ‘A/B testing: Cause, effect and uncertainty’. We reminded the room that seeing a pattern is not the same as proving a result. We focused on how to move beyond simple correlation to identify underlying cause-and-effect relationships, ensuring that, even as data becomes scarcer, our conclusions remain scientifically valid.

Matt Gershoff on A/B testing & uncertainty – Superweek 2022

In our 2023 talk, we went a step further –  not only providing the technical solutions, but also showing the values behind Conductrics. Building on the concept of Enlightened Hospitality by Danny Meyer, Matt discussed that the real goals of optimization are not to improve conversions, but to better serve the customer and, even in small ways, enrich their lives. 

By 2024, as the cookie crumbled, we brought “Privacy engineering in analytics and A/B testing” to the Superweek stage. Even though the GDPR has been in force for years and the concept of data minimization has been discussed, the industry remained uncertain about how to work with less data, often viewing it as a disadvantage. We were there again, arming attendees with new options to make informed decisions. Finally, in 2025, Ezequiel Boehler, Solutions Architect at Conductrics, joined Matt on stage for “Bandits Bounce Back”, bringing a fresh perspective to the stage as we revisited one of our favorite topics. 


Image
Paula Sappington, Matt, and Ezequiel –  Superweek 2025

More than just talks: Community over commerce

If the presentations are the brain of Superweek, the time spent between them is the heart. 

Sponsoring Superweek for Conductrics is not about the logo on a lanyard. We sponsor it because it’s one of the few places that prioritizes community over commerce. It’s a “safe space” for data people – a snowy retreat where you can argue about attribution models at 2 AM by a fireplace, and where titles matter less than ideas. 

“In a world filled with cynicism, Superweek Analytics Summit is about nothing if not about having total integrity. By being neither vendor nor agency Zoltán Bánóczy and Bernadett Király are able to put on one of, if not the only, conference in the world that is strictly for the attendees… No demos, no pitches… just providing a space for building relationships with other humans.”
Matt Gershoff, Conductrics CEO, in his 2025 after-Superweek post

We try to contribute to that environment the best way we know how: by creating space for those relationships to form. 

By now, the Conductrics Fireside Pub Quiz has become a tradition – we love being the catalyst that gets people talking. It serves as an ultimate icebreaker, lowering professional guards and turning a room full of attendees into a genuine community.


Image
Fireside Pub Quiz with Matt Gershoff – Superweek 2023

What we’re bringing to the bonfire in 2026

So, what does year 12 look like? We’re continuing to refine that essential mix of community and rigor. We are thrilled to confirm that the Fireside Pub Quiz is back on the agenda for Monday evening. And on the stage, we’re splitting our brain between the human and the machine. 

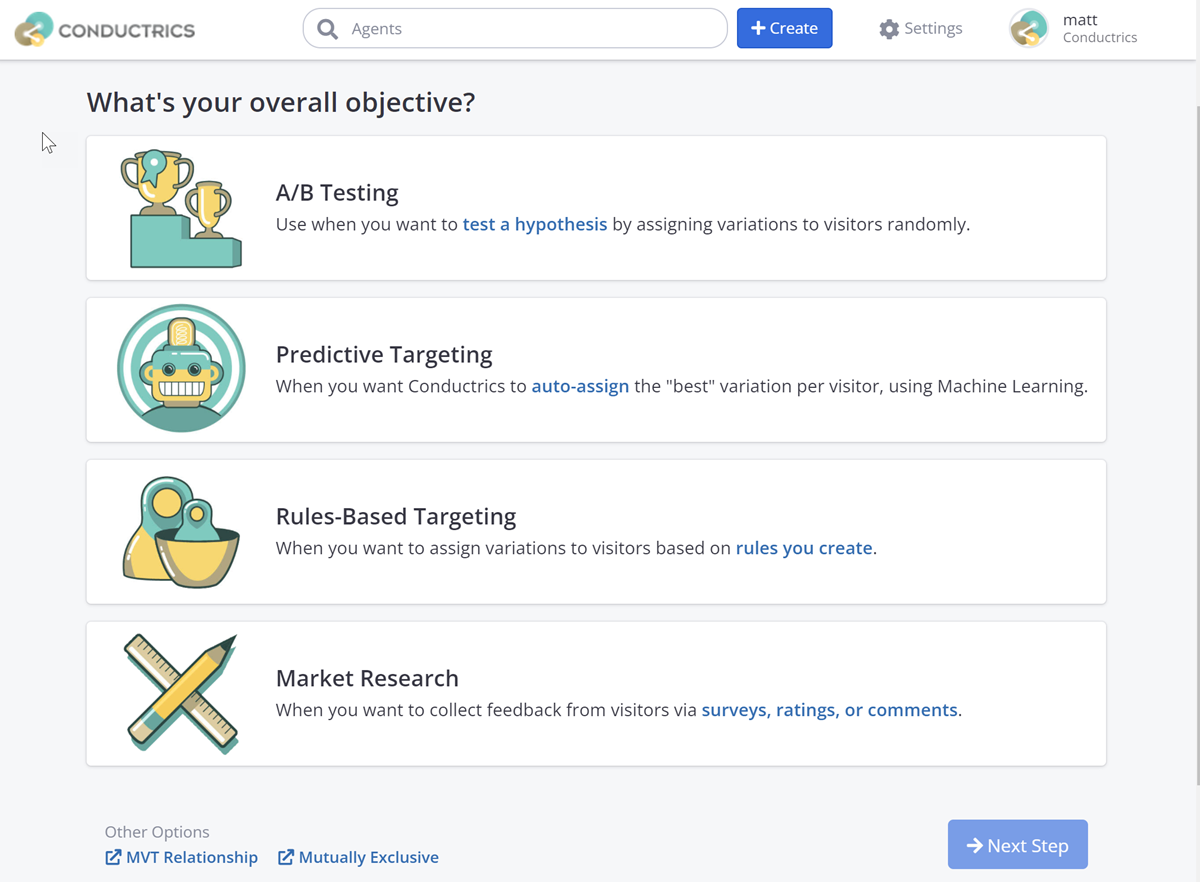
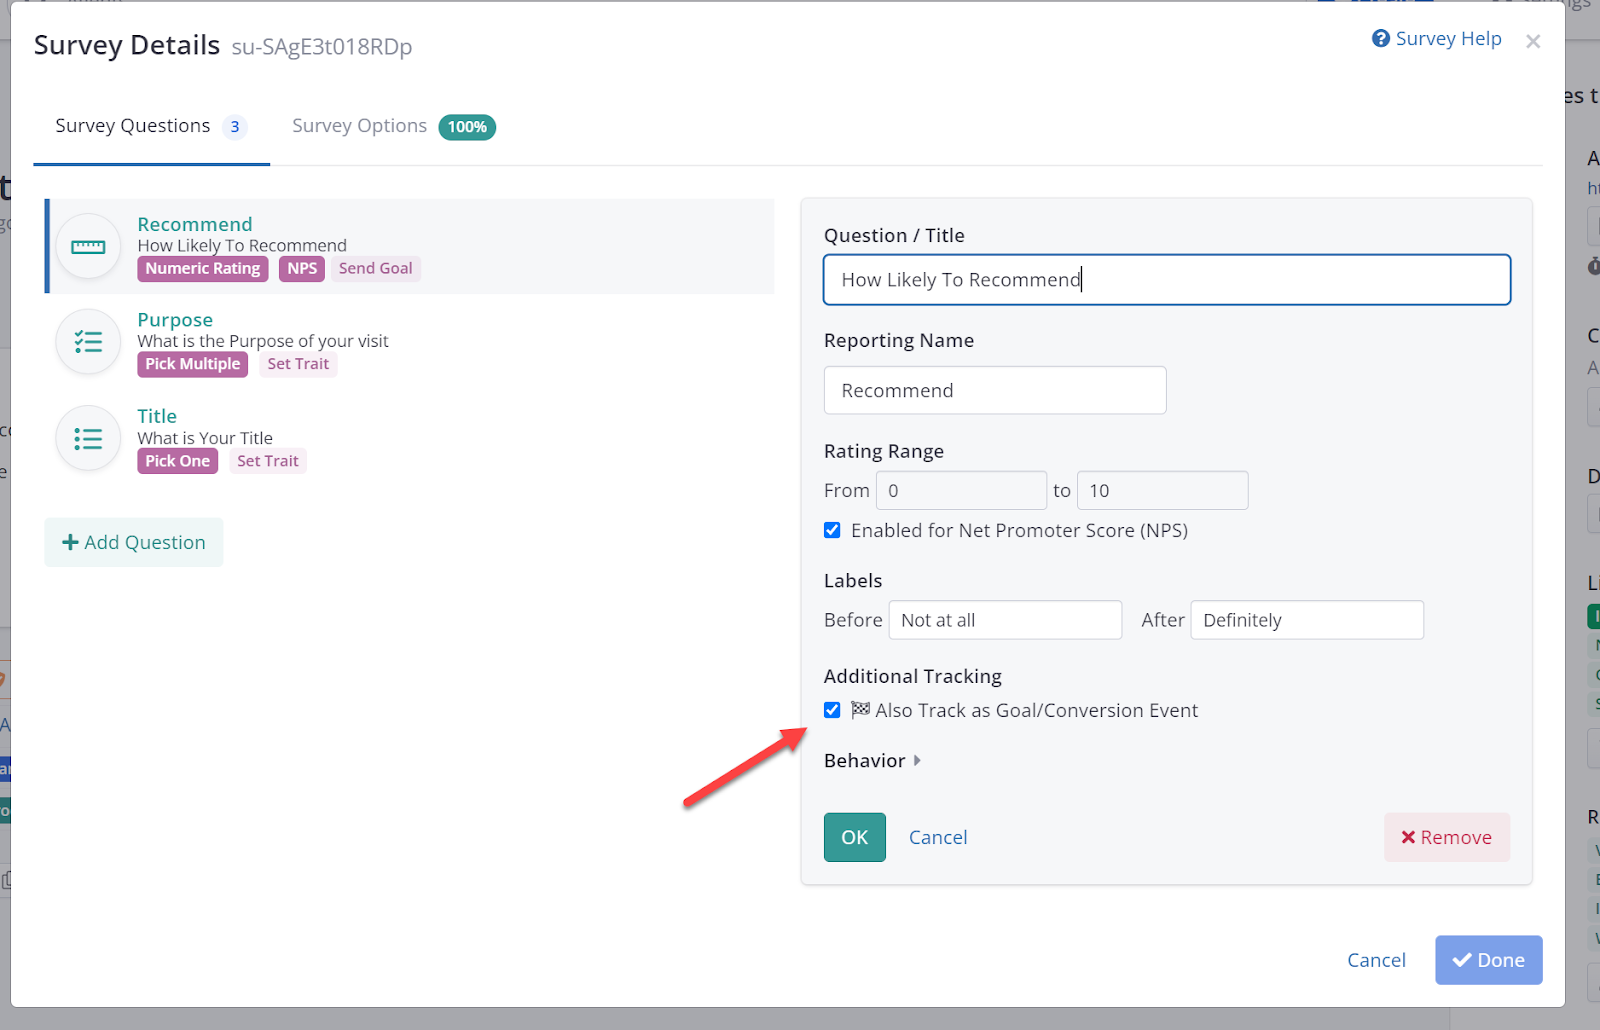
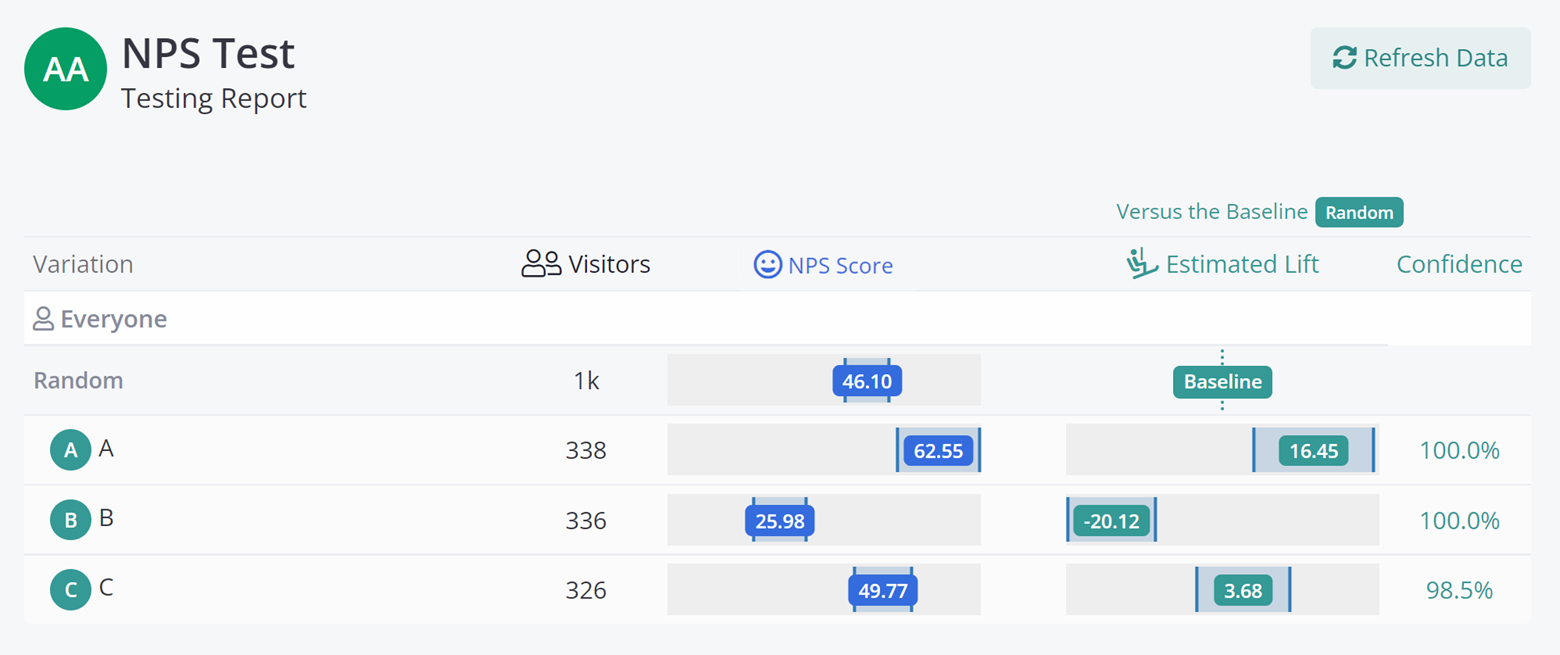
Ezequiel Boehler will tackle the human side in “Integrating Customer Feedback into the Optimization Flywheel.” We often get stuck thinking we need more sophisticated machine learning to solve our problems, when we would sometimes make more progress by asking our customers directly. Ezequiel will review how to blend customer feedback with A/B testing to get to the ‘Why” faster.

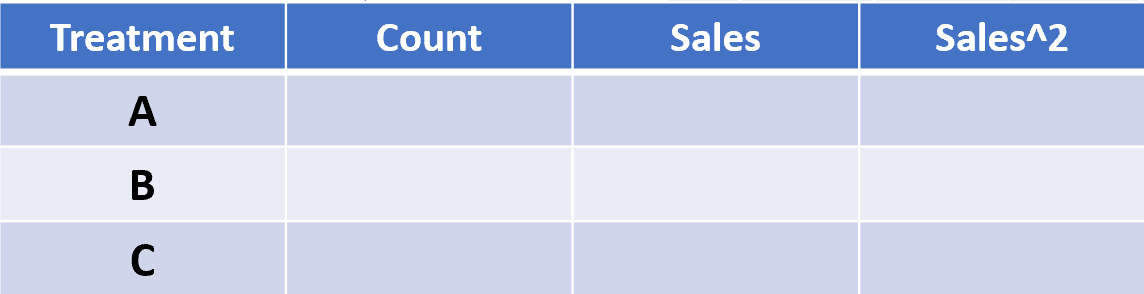
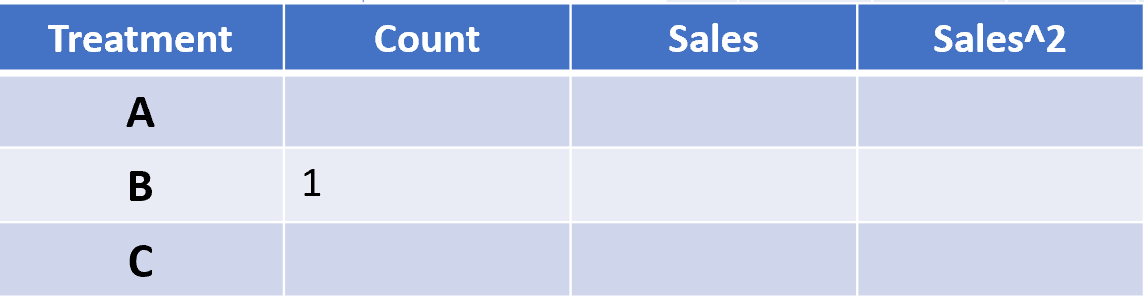
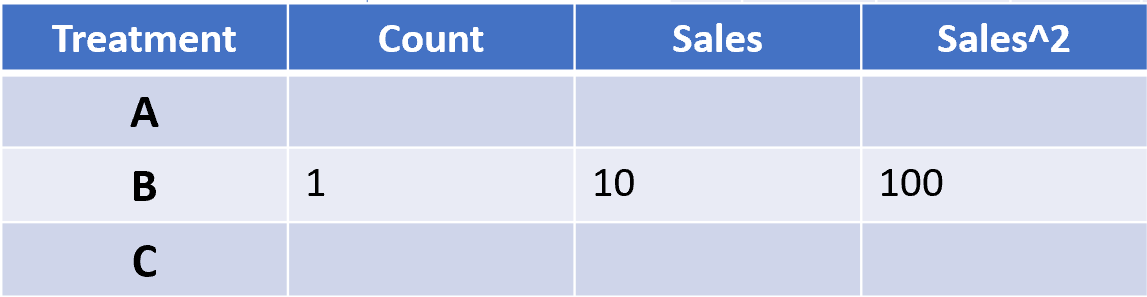
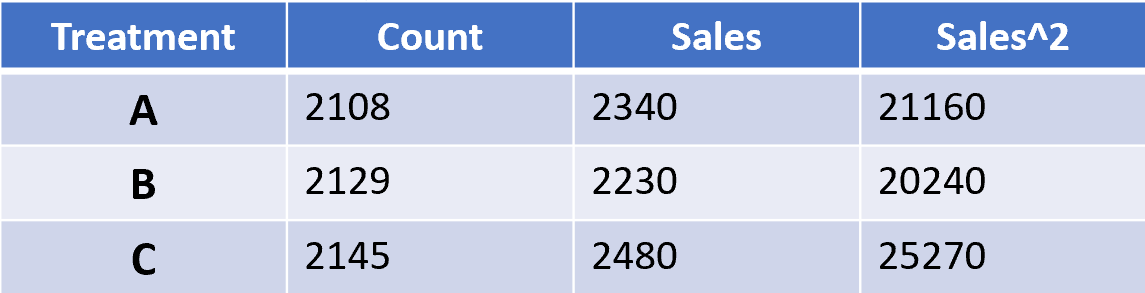
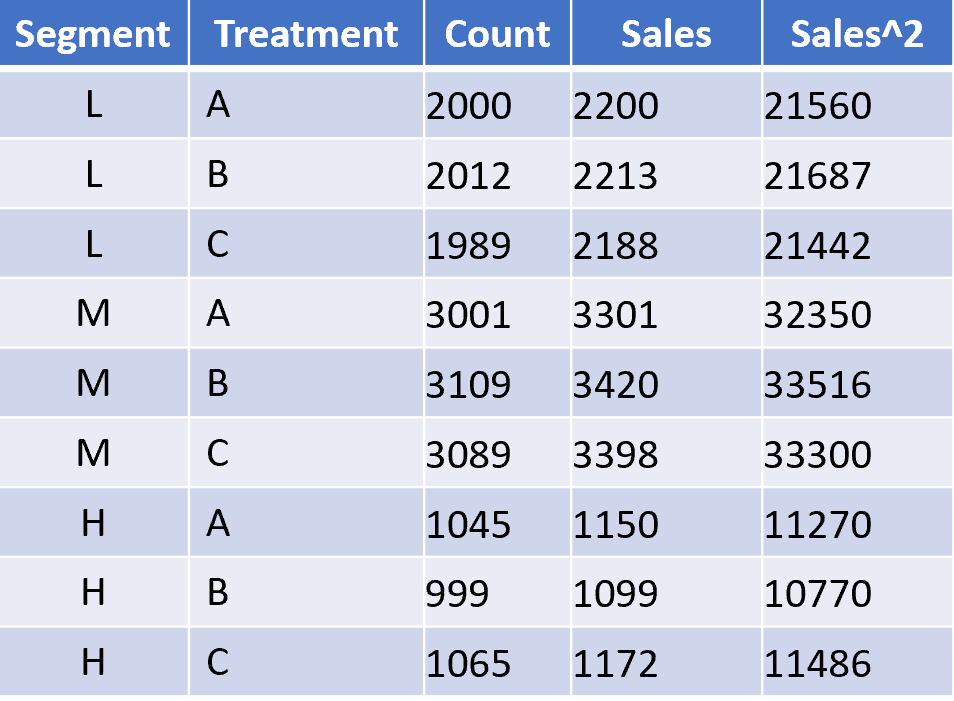
Meanwhile, Matt Gershoff is heading back to the statistical chalkboard with “Interactions: When 1 + 1 ~= 2.” If you’ve ever worried that your concurrent A/B tests are interfering with each other, or if the data actually supports targeting different experiences to different customer groups, this session is for you. It’s a straightforward look at how to model and answer the question: “Are there interactions?”

See you on the mountain

For us, Superweek is that rare ‘winning variation’ that just keeps getting better. It’s a unique environment where we can jump from the math of interaction effects to the warmth of human connection, all while sharing a s’more by the bonfire with the smartest people in the industry.

We’re proud to support it, excited to return, and we hope to see you there.
 

Image
Ashley Teague, Director of Sales at Conductrics – Superweek Analytics Summit 2025
Posted in Uncategorized | Leave a comment


Interpretable Machine Learning and Contextual Bandits

At Conductrics we believe that intentional use of machine learning and contextual multi-armed bandits (MAB) often requires human interpretability. Why?
1) Compliance – in many environments it is important to insure that policies are followed about how and when different people get offered different experiences. In order to ensure compliance with those policies/regulations (for example see Art 22 of GDPR) it is often important to know exactly who will get what before using any targeting technology. 
2) Understanding and Trust – Your teams are, or at least are striving to be, experts about your customers. Having interpretable results allows them to both catch any inconsistencies (“hey, something is off, there is no way there should there only be 3% of our customers who are both Repeat and High Spenders”), and glean new understandings (“oh, that is interesting, our Low Spend Repeat buyers really seem to prefer offering ‘B’. Lets maybe run a few targeted follow up A/B tests around that segment with related ideas similar to that ‘B’ offering. Better yet, lets also set up an A/B Survey to ask that segment a few clarifying questions around what their needs are to get a fuller understanding of their needs.”).

To help facilitate interpretability, Conductrics represents its learning and contextual bandit models in a tree structure that makes it very easy for teams to be able to parse the learning/bandit logic in order to see both which segment data was selected and to give a quick scan of which options each audience prefers.

Conductrics Tree View

Image


It can also be useful to see the contextual bandit as a set of mutually exclusive rules where the teams can see the size, the conditional probabilities of each option to have the highest value, as well as a visual of the estimated underlying conditional posterior distributions that give rise to those conditional probabilities.

Conductrics Rule View

Image
In real world applications, being productive with MAB goes beyond which algorithm to use – in fact, that often is the least important consideration. What is important is to think about the nature of your problem, the set of objectives, and then to select and use an approach that is best able to help you achieve those objectives.

In addition, for many use cases targeting and bandit models really should be integrated into an A/B Testing structure.  A/B Testing and MAB are NOT substitutes, but rather complimentary approaches.  MAB when run on problems were it doesn’t matter what option is selected, or when, often will appear to be finding a ‘better’ solution then just randomly selection the options. That means that most often it makes sense to A/B test the Bandit. 

A/B Testing Contextual Bandits

Image

Remember, multi-armed bandits, simple or contextual, are just additional tools in your toolkit. Let the job guide your pick of the tool rather than tying to look for the jobs that fit the tool. 

Posted in Experimentation, Predictive Learning, Privacy by Design, Uncategorized | Leave a comment


CUPED’s Sting: More Power More Underpowered A/B Tests

The benefit of using Regression Adjustment (CUPED) for A/B Testing is that in certain cases it can increase the precision of the experiment’s results.  However, if one isn’t intentional in the design and set up, this more powerful approach can easily lead to underpowered experiments.

What is Regression Adjustment/CUPED

One can think of regression adjustment/CUPED as a way to recycle data.  If you have access to pre-experiment data that is correlated (explains some of the variability) with the upcoming test’s KPI (end-point), then by including this data when analyzing the post test data you can reduce the amount of noise, or variance in the final result.  This variance reduction can be used to either increase the precision of the estimated treatment effect, or it can be used to reduce the required sample size compared to the unadjusted approach.   

The amount of variance reduction is directly related to the reduction in the required sample size for given Type 1 (alpha), Type 2 (beta), and MDE. The amount of reduction relative to the unadjusted approach is based on the following relationship Var(Y_ra) = Var(Y) * (1 – Cor(Y, Covariate)2), where Y is the test’s KPI and the covariate is the pre-treatment data.   For example, if the correlation of the covariate and the KPI is 0.9, then the effective variance of Y for the experiment will be 1-(0.9)2, or 19% of the unadjusted variance of Y.  Since the variance of our KPI drives our sample size, this also means we need only 19% of the sample size that would be required for the unadjusted test given the same Type1, Type2, and minimum detectable effects sizes. 

Wow, an 81% reduction! Huge if True! But is it true? Well, yes and no. For sure it is true relationship between the variance of Y, the covariance of Y and some covariate(s), and the sample size. However, like most things in analytics/data science, the issue isn’t really about the method but in its application and context. 

For standard (Pearson-Neyman) A/B Tests calculating the required sample size requires the following inputs, the rate of Type1 control (this is the alpha, often set to 0.05), the rate of Type2 error control (this is related to the power of the test often set to 80%), the minimum detectable effect (MDE), and the baseline variance of the test metric (for binary conversion this is implied by the baseline conversion rate).   So we can think of basic sample size calculation as a simple function, f(alpha, power, MDE, variance(Y)).  We get to pick whatever alpha, power, and MDE we want to configure the test, but we need to estimate the variance of Y. If we underestimate the ‘true’ variance of Y, then our test will have less lower power then what we specified.   

For the CUPED/Regression adjustment approach we need to add an additional estimate for the correlation between the covariate and Y. Our sample size function becomes f'(alpha, power, MDE, variance(Y), correlation(Covariate, Y)).   Notice is that the effect of the correlation is quadratic.  This means the any mis-estimation of the correlation when the correlation is high will have a large effect on the sample size. But this is exactly when CUPED/Reg Adjustment is most valuable. 

To illustrate, if we estimate the variance to be 100 but really the baseline variance is 110. Holding our MDE and alpha fixed, underestimating the baseline variance leads to a slightly underpowered test – instead of a power of 80% our test would have a power of 76%.  So less powerful, but not drastically less. 

However, lets say we have some pre-test covariate data and we over estimate its correlation with Y. Let’s use as an example an estimated 0.9 correlation coefficient since this has been used by others who promote a more indiscriminate use of CUPED.  However, rather than the having a 0.9 correlation, our KPI during the testing periods is closer to having a  0.85 correlation.  

This results in our A/B Test having too few samples, or conversely, being underpowered since we should run the test at (-0.852), or for 27.8% of the unadjusted sample size, rather than only 19% as suggested by a correlation of 0.9.  Below is the output of t-scores from simulations of 5,000 A/B tests where the actual treatment effect of the test is set exactly equal to the MDE. A test configured to have 80% power should fail to reject the null only 20% of the time.  In the simulations we use the sample size suggested by a correlation coefficient of 0.9. In the simulation we ran: 1) a standard unadjusted difference in means t-test; 2) a regression adjusted t-test with a covariate that has only 0.85 correlation with Y;  and 3) a regression adjusted test with a correct estimate of 0.9 correlation of the covariate and Y.  Both 1 and 2 versions of the tests are under sampled for given a desired power of 80%.

Image

The unadjusted A/B tests (Purple) are shifted to the left of the 1.645 critical value with 70% of all tests failing to reject the null for the one tailed 95% confidence test. This make sense because we only have 19% of the required sample size.  The regression adjusted test with the correct estimate of 0.9 (Green) has just 19.8% of the tests to the left of the 1.645 critical value, which is the expected 20% fail to reject rate (80% power).  The regression adjusted tests using a covariate that has only 0.85 correlation rather than 0.9  (Red) is shifted to the left such that we fail to reject 34% of the tests, for a power 66%.  So even though we have data that can massively increase the precision of our results versus the unadjusted t-test, we still wind up running under powered tests. Which of course is highly ironic. It means that exactly when CUPED/Regression adjustment are most useful, if we are not careful in our thinking and application, it is also exactly when we are mostly likely to increase our chances of running highly underpowered tests. 

Why? Our estimates of correlation are based on sampling the data we have. Often A/B tests have different eligibility rules, so each test, or family of tests, will need to have its own correlation estimate. Each estimate requires a faithful recreation of these eligibility rules to filter on the existing historical data.  As we generate many of these estimates, each on subsets of historical data, it becomes more likely that we have a nontrivial share of them with under estimates of correlation.  This increases the odds of mis-estimation even if the underlying data is stationary. If the data is not stationary, then it is even more likely we will run underpowered tests. 

Of course this doesn’t mean don’t ever use regression adjustment/CUPED. For example, here a simple, admittedly ad-hoc fix might be to just use a slightly more conservative estimate when the correlation estimate is very high especially when its based on limited historical data for finer sub-sets of the population. However, it does suggest that the promises about more advanced methodologies are often broken in the details, and that one should be intentional and thoughtful when designing and analyzing experiments.  Good analysts and good experimentation programs don’t just follow the flavor of the day. Instead they are mindful of trade-offs, both statistical as well with the human factors that can affect the outcomes. 

Posted in Experimentation, Uncategorized | Leave a comment


The A/B Testing Industry: Why Attitudes Matter

At Conductrics, we enable companies to run A/B and MVT experiments, optimize campaigns with contextual bandit technology, and provide relevant customer experience and insights through our A/B Survey technology.  However, as great as our technology is, ultimately we believe that the overarching value of any experimentation program is in how it provides a principled procedure for companies to be explicit in their beliefs and assumptions about their customers. This means companies being intentional about what to learn and what actions to take, and to take those actions based on the value it provides for their customers and organizations. 

This view of experimentation is what guides how we develop and service our products. It is why our experimentation platform allows for K-anonymized data collection and is built following Privacy by Design (PbD) principles (link to our paper on K-Anonymous A/B Testing). PbD, especially the principle of data minimization ultimately involves thinking about how the next additional bit of collected data adds value the customer – an idea that is cut from the same cloth as intentional experimental design. Our novel A/B Survey technology helps our clients be more mindful and responsive to not just the technical delivery of their services, but how that service makes their customers feel. It guides us to think first about about how more complex statistical methods might have unintended consequences before pushing them to market. For example, more complex methods, like CUPED and regression adjustment can do wonders for precision and reduced time to test by efficiently recycling existing data. But to be useful that data needs to exist, and the application of these methods requires the input of additional hyper-parameters and additional pre-experiment data estimates. Perhaps more importantly, if these methods are blindly used without understanding certain nuances in their setup, they can unintentionally lead to increases in both Type1 and Type 2 errors.

Our intentional lens is not the mainstream industry view. The current prevailing view is that value is achieved less through the goal of intentional decision making, and more through the goal of scale. This view of A/B Testing and Experimentation is influenced by both ideas and money from Venture Capital.  Being more Peter Thiel than George Box (see ’76 Science and Statistics), it is a techno-solutionism that rests on appeals to emulate the actions of the few top tech companies – Amazon, Alphabet, Meta, Microsoft, and Netflix.  The implicit argument goes like this:  The big and successful tech companies represent a potential ideal future state. These big tech companies run thousands of experiments with an ever increasingly complex set of statistical methods. So experimentation appears to be a core reason they are successful. Therefore emulating their experimentation programs and methods is a requirement and path for other companies to also arrive at the more advanced, and successful state.

Ironically, this argument about the value of A/B testing, a causal inference approach, rests mostly on a correlation between running experiments at scale and success. Sadly, it ignores potential confounding effects such as the fact that successful tech companies already have many PhDs on their payrolls who are experts at working with code at scale and that these companies have the capacity to run experiments at scale.  So it is not clear whether success and earnings are caused by the act of mechanizing experimentation or some other factors associated with the skills or resources of these companies. If the value from this approach is generalizable, why is it the same 5 to 10 technology companies that are the experimentation role models year after year. Why aren’t companies from other industries being added each year to the list of innovators?  

It is not that expanding experimentation, and improving efficiency can’t be extremely valuable – it often is. However, the mere act of implementing software, and then productizing the running of 1,000’s of experiments is unlikely to provide much learning or value. Inference is not a technology. In order to learn, an experimentation flywheel needs to also incorporate Box’s learning feedback loop where “ … learning is achieved, not by mere theoretical speculation on the one hand, nor by the undirected accumulation of practical facts on the other, but rather by a motivated iteration between theory and practice …” (Box ‘76). It is intentional experimentation, rather than performative experimentation, that leads to organizational learning. 

There has always been an internal inconsistency, or at least tension, inherent in the scale/velocity approach to A/B Testing. What the VC world really cares about is Type 2 errors – the false negative. It is the lost opportunities that have the exponential loss – the miss of investing early in Google, Facebook, Netflix, etc. The world of the fat tail payoffs and power laws lurking in shadows. Type 2 errors are the concerns of people of action – the bold. The leaders and innovators who Move Fast and Break Things.  Worrying about Type 1 error, the false positive, as part of learning is to be conservative and from the VC view of the world, for the meek, the NPCs, the followers.

The funny thing is that the gateway to experimentation, A/B Testing (at least the Pearson-Neyman approach) is fundamentally about controlling Type 1 errors (see Neyman ‘33). Yet controlling these errors incurs a cost in both samples and in time. But reducing time to action is a key guiding principle of the scale and velocity view. So ‘new’ methods and additional complexity need to be continuously sold to mitigate this hold up – e.g. continuous sequential designs, regression adjustment etc.. Any considerations about potential trade-offs and unintended consequences of this added complexity (biased treatment effects, inflation factors, computing costs, increase of hyperparameters, errors due to human factors) are ignored as part of the sale. Even if we ignore these trade-offs, as we hit the limit of speed ups from these approaches, the demand to reduce time to action will build and we will see more arguments to reduce, or eliminate Type 1 error control as the default behavior, rather than as the exception. 

That is not inherently bad. Having developed and worked with A/B Testing and Reinforcement Learning/Bandit tech for years, it has been clear that different classes of problems require different approaches. We have written extensively on the benefits of reducing Type 1 error control (See our Power Pick Bandits posts here and here). But that decision is based on being mindful of the problem at hand, and then selecting the right solution with an understanding of the various trade-offs.

Of course all things come with a cost and like medicine, both increased use of and the added complexity in tech can have both positive and negative effects. Also like medicine, tech solutions can be over subscribed leading to the field becoming addicted to complexity, always seeking more when less maybe more beneficial.

In many cases these approaches are helpful, and we use many of them here. However, when used mindlessly without intention they can be less than helpful. Simply trying to emulate the successful, if one is not careful, can lead to a mindlessness of action, and a costly ritual of performative experimentation, rather than leading to enlightenment and understanding of the customer.  Perhaps being seen as performing the same rituals as the successful can have its own signaling benefits. But scaling experimentation for the optics is a costly shibboleth.   

There is no ground truth here.  There are just different attitudes and ways of seeing the world. But attitudes matter. They inform next steps and the most fruitful future directions to follow.  Our view is that experimentation is of value not just in the doing but when it both helps clarify beliefs and makes assumptions explicit and as a process to iteratively update and hone those beliefs based on direct feedback from the environment. 

Posted in Experimentation, Implementation, Privacy by Design, Uncategorized | Leave a comment


Adjusted Power Multi-Armed Bandit

At Conductrics, two of our guiding principles for experimentation are:
Principle 1: Be mindful about what the problem is, preferring the simplest approach to solving it.
Principle 2: Remember that how data is collected is often much more important than how that data is analyzed.

Often, in the pursuit of ‘velocity’ and ‘scale’, the market will often over promote ever more complex solutions that tend to be both brittle and increase compute costs. Happily, if we are thoughtful about the problems we are solving, we can find simple solutions to increase velocity and growth.  The Power Pick Bandit introduced by Conductrics in this 2018 blog post is a case in point.

In this follow up post we will cover two significant extensions to the Power Pick Bandit:
1) Extend the power pick approach for cases when there are more than two arms;
2) Introduce a two step approach that controls for Type 1 error when there is a control.

Power Pick Bandit Review

As a quick review, the power pick bandit is a simple, near zero data analysis, multi-armed bandit approach.  The bandit is set up just like an A/B Test, but with one little trick. The trick is to set alpha, the type 1 error rate, to 0.5 rather than something like 0.05. This will reduce the number of samples by almost a factor of four.  Even though there is almost nothing to it, this simple approach will find a winning solution, IF THERE IS ONE, at a rate equal to the selected power. So if the power is set to 0.95 then the bandit will pick the winning arm 95% of the time. 


Power Pick Multi-Arm Case

Let’s say that rather than selecting between two arms we had 10 arms to select from. How can we best apply the power pick approach? The naive case is to just multiply the per arm sample from the 2 arm case by 10. Let’s say we have a problem where the expected conversion rate is 20%. We want our bandit to have a 95% probability to select an arm if it is 5% better than that average. In the case below  Arm 2 has a true conversion rate of 21% and all the other arms have a true rate of 20%.

Image

We decide to use the power pick approach and we naively use a power of 0.95. Using our sample size calculator we see we will need approximately 8,820 samples per arm. Running our simulations 10k times, with 88,200 samples per simulation we get the following result:

Image


The arm with the 21% conversion rate is selected 77% of the time, and one of the 9 other arms are selected 23% of time.  Not bad but not at the 95% rate we wanted. 

Adjusted Power

In order to configure the many armed bandit to select a winner at the desired probability we borrow the Bonferroni adjustment, normally used for FWER in A/B tests with multiple comparisons, and apply it to the power. To adjust for the desired power we divide the Beta (1-power) by 1 – minus the number of arms in the problem. For our case we want the power to be 0.95, so our adjusted power is
Adj Power = 1-[(1-0.95)/(1-10)]=0.9944. 
Using the Adj Power forces us to raise our sample size to 210K from 88K.  After running our simulations on the larger sample size we select the best arm 96% of the time (Bonferroni is a conservative adjustment so we expect slightly better error control). 

Image


While the number of samples needed is much greater than in the naive approach, they are still fewer than if we had used a naive A/B test approach. 

Image

The adjusted power approach uses 40% less samples than a simple 10 arm A/B Test. Beyond being a useful tool to easily optimize a choice problem when there is no type 1 error costs, it highlights that most of the efficiency of using a bandit vs an A/B Test is not in any advanced algorithms. It is almost entirely because the A/B Test has to spend resources controlling for Type 1 errors. 

But what if we do care about Type 1 errors? 

The Two Stage Adjusted Power Pick

Let’s adjust our problem slightly. Instead of trying to select from 10 arms, where we don’t care about type 1 error, let’s imagine that one of the arms is an existing control. We have a set of 9 other arms and we just want to quickly discover if any one of them might be a promising result.

Since we have an existing control, we want to ensure that we control for false positives at the 5% rate. 
The standard way to do this is to run a single Bonferroni (or pick your favorite adjustment for FWER) A/B test. To estimate the sample size we adjust the alpha of 0.05 to 0.05/(10-1)=0.0056. To keep the simulation time down, we use a power of 0.8. The number of samples for the Bonferroni corrected 10 arm A/B test is 372k.  

However, the Bonferroni approach uses extra samples to test each alternative against the control. But growth teams often have situations where there is a large set of potential alternatives where they want a way to first quickly bubble up the best option and then test that option against the control. For these cases we propose the Two Stage Power Pick approach. First, run an adjusted power bandit on all 10 arms, including the control. If the control is the winner, stop and move on to some other problem. If the winner is not the control, then run a two arm A/B Test between the control and the winner. 

There is one additional technical consideration. In our case we want the joint power over both stages to equal 80%. If we ran stage one at a power of 95% and the stage two power at 80%, the joint power would be only be 76% (0.95*0.80=0.76). To account for this we adjust the second stage power so that the product of stage one and stage two power equals the desired power. This can be achieved by dividing our desired joint power by the stage one power. So if we want a joint power of 0.80 and the stage one  power is 0.95, the adjusted power for stage two is 0.80/0.95 = 0.8421.

The following results are when there is a single arm that has a 21% conversion rate when all the other arms, including the control have a 20% conversion rate.  Notice that both approaches have a power of at least 80% as expected. However, for this case, on average, the two step approach needs only 256K, which is 30% less data than the Bonferroni A/B test . 

Image


What about when none of the arms are different from control?

Image


After running 10k simulations we see that both approaches control type 1 error at or below the 5% level. Also note that the average sample size for the 2 Step approach is slightly less under the null than when there is a ‘best’ arm. This is because on average 10% (more generally 1/k where k number of arms) of the time the control will ‘win’ the first step and the procedure will terminate.

Image

Of course there is no free lunch.  There are trade offs around how the various approaches will perform depending on the relative payoffs between the various arms. In cases where it is the control that has the highest conversion rate of all the arms, then the two step approach will terminate early more frequently, resulting in a sample size that approaches the samples needed just for the first stage (because the control will get selected as the winner of the first stage with high probability) .  However, the two step approach is less robust in cases when there are sub optimal arms that are both better than the control but are less than the specified minimum detectable effect. For example a case where one arm is better than the control by the MDE, but all of the other arms are better than the control by one half of the MDE. 

Image

Comparison of Results

In the chart below, we have three scenarios: 1) Where there is just one arm that is MDE better than the control with 8 other ‘null’ arms; 2) our hard case from the above chart, with all the alternative arms better than the control, but with just one arm a full MDE better; 3) An easier case where there are two arms MDE better than the control, with 7 other ‘null’ arms. 

In the first scenario both approaches achieve the desired power of 80%.  For the hard problem in the second scenario both the two stage adjusted power approach and the Bonferroni adjusted A/B Test have reduced power. The two stage approach is however less robust, with an achieved power of 52.4% vs a power of 69.5% for the Bonferroni. In the third case where there are two arms better than the control by the MDE and all the other arms equal to the control both methods achieve at least 80% power, but the Bonferroni approach is better able to take advantage of this easier problem.  Of course this additional sensitivity of the adjusted power approach is balanced by requiring much less data – 30% less when it runs both stages and over 40% less when it terminates early when the control is the best arm. 

Image


For many situations, especially for growth teams, where there is a large set of possible solutions and the team would like to increase their testing velocity, using the adjusted power approach can be a very useful tool. For basic bandit problems it provides a simple, low tech, easy to manage approach that is surprisingly effective. For discovery type tests, where we want to quickly surface a promising challenger from a large set of options before testing it against an existing control, the two step adjusted power test can be a faster alternative than the standard multiple comparisons adjusted A/B Test. 

If you have any questions or are interested more in what we are working on over here at Conductrics please feel free to reach out.  

Posted in Experimentation, Predictive Learning, Uncategorized | Leave a comment


Experimentation and Privacy by Design

The Value in Being Intentional and Customer Focused

Privacy in analytics is often considered a constraint or a barrier that limits our actions or our ability to develop powerful technological solutions. However, embedding privacy by design principles—such as data minimization—actually enhances our systems and software. Why? Because it aligns with our field’s primary value proposition: The main value of experimentation/AB Testing programs is that they provide a principled framework for organizations to act and learn intentionally so that, ultimately, we can be customer advocates. 

It is our view that privacy by design thinking is inherently intentional thinking. It’s good engineering that puts the customer first and requires one to explicitly ask ‘why’ before collecting additional information. Privacy by design helps us be outcomes-based (focus on the customer) vs. compliance/procedure-based (focus on the organization).

We have found that by following privacy by design engineering principles, we have not only been able to engineer data minimization and privacy by default designs directly into Conductrics’s software, but this has had the happy effect of also leading to multiple benefits, including data storage, computational, and reporting efficiencies.

What is Privacy by Design?

Privacy by design (PBD) is a set of engineering principles that seek to embed privacy-preserving capabilities as the default behavior directly into systems and technologies.
The seven principles, as originally specified by Dr. Ann Cavoukian, are:

  1. Proactive, not reactive – That is, systems should be intentional and anticipate privacy requirements rather than responding to privacy issues after the fact 
  2. Privacy as the default setting
  3. Privacy embedded into design
  4. Full functionality – That is, privacy should not unreasonably impair access or use. 
  5. End-to-end security
  6. Visibility and transparency
  7. Respect for user privacy

At Conductrics INC we came across Privacy by Design back in 2014/2015 after stumbling on Article 22 of GDRP (Automated individual decision-making, including profiling).

At the time, we were looking to refactor our original predictive targeting/contextual bandit features to make it easier for our customers to quickly be able to understand which of their customers would get which experiences. For those not familiar, contextual bandits are a machine learning problem where one wants to jointly solve the problem of: 

  1. Discovering and delivering the best treatment for each user in an ongoing, adaptive way (often called heterogeneous treatment effects); and 
  2. The sub-problem of discovering which covariates (contextual information) are useful to find those best treatments.

When we learned about the then upcoming GDPR and Article 22 (Automated individual decision-making, including profiling), we decided that we needed to make interpretability a first class feature of our predictive targeting/bandit feature. That meant scraping the normalized radial basis function net we had built for something, simpler and more transparent. To our surprise, by using a few clever tricks, making the Conductrics predictive engine less complex, not only enabled interpretability, but made it much more computationally efficient and improved the over all efficacy the system.

However, Art 22 led us to Art 25, and its mandate to embed data minimization into the design of software. That ultimately led us to refactor all of our data collection and statistical procedures so that we could both provide all of the analysis needed for AB Testing (t-tests, partial f-tests, factorial ANOVA, and ANCOVA) and incorporate K-anonymization into our data storage and report/auditing. 

Why Bother with Privacy by Design? 

It’s a requirement. 

Art 25 of the GDPR is titled “Data Protection by Design and by Default”

“The controller shall …implement appropriate technical and organizational measures … such as data minimisation…in an effective manner and to integrate the necessary safeguards into the processing in order to meet the requirements of this Regulation and protect the rights of data subjects.”

It puts the customer first. 

Following privacy by design, we have found, aligns with ensuring that products are more useful for customers—Instead of maximizing a customer’s value to the company, one builds and offer products and services that maximize the company’s value to their customers. 

Privacy engineering and data engineering are both about privacy and about why we’re performing data analytics and experimentation in the first place. Again, our view is that the value of experimentation is that it provides a principled procedure for organizations to learn, make decisions, and act intentionally. The ultimate reason for doing this is to help teams —who are near the front line of the business, where engagement happens—to act as customer advocates.

According to Fred Reichheld, creator of NPS, “There is no way to sustainably deliver value to shareholders or be a great place to work unless you put customers first.” As the front line in customer interactions, analysts have the opportunity to accomplish what should be the main purpose of the business—to enrich customers’ lives by being mindful of what they want and anticipating their needs. 

Privacy engineering is good engineering. 

When designing a product, often solving one problem or feature can negatively affect other aspects or dimensions of the product. Much like a Rubik’s cube, there are various ways to solve just a single side of the puzzle, but these solutions are local—once you solve them, they leave the other sides of a problem in disarray. 

It turns out, happily, that for many of the statistics needed for tasks like AB Testing, most of the  statistical approaches used for inference in AB Testing (ANOVA, ANCOVA, t-test, partial f-tests, etc.) can be performed extremely efficiently on aggregate data stored in equivalence classes (similar to a pivot table—see a more technical view of this here). The use of equivalence classes data, rather than individual microdata, facilitates the ability incorporate K-anonymization as a simple to read measure of data minimization. Given an individual in a dataset, K-anonymity, roughly, is the minimum number of other users who are indistinguishable from that individual. Larger K’s in some sense can be said to provide more privacy protection.

Intentional Data Collection and Use

There are of course many use cases where it is appropriate and necessary to collect more specific, and identifiable information. The main point is not that one should not ever collect data, rather one should not collect, link, and store extra information by default just in case it might be useful, we should be intentional for each use case about what is actually needed and proceed from there.

Lastly, we should note that data minimization and other privacy engineering approaches are not substitutes for proper privacy policies. Rather, privacy engineering is a tool that sits alongside required privacy and legal compliance policies and contracts.
If you would like to learn more about Conductrics please reach out here. 

Posted in Experimentation, Privacy by Design, Uncategorized | Leave a comment


Privacy Engineering in AB Testing

Conductrics takes privacy seriously. Conductrics AB Testing has been developed in conformance with Privacy by Design principles in order to give our clients the privacy options they need. This is important for: 1) maintaining customer trust by safeguarding their privacy; and 2) in order to comply with privacy regulations that require systems to be designed with default behaviors that provide privacy protections. 

For example, Article 25 of the GDPR requires “Data protection by design and by default” and explicitly proposes the use of pseudonymization as a means to comply with the overarching data minimization principle. Technology should be designed in such a way that by default the scope of data collected is limited to “only personal data which are necessary for each specific purpose of the processing are processed.”  In other words, if a task can be performed without the use of an additional bit of data, then, by default, that extra bit of data should not be collected or stored. 

With Conductrics, clients are able to run AB Tests without the need to collect or store AB Test data that is linked directly to individuals, or associated with any other information about them that is not explicitly required to perform the test.  Out of the box, Conductrics collects AND stores data using data minimization and aggregation methods.

This is unlike other experimentation systems that follow what can be called an identity-centric strategy. This approach links all events, experimental treatments, sales etc., back to an individual, usually via some sort of visitor Id. 

For clarity, lets look at an example. In the table below there are three experiments running; Exp1, Exp2, and Exp3. Each experiment is joined back to a customer such that there is a table (or logical relationship) that links each experiment and the assigned treatment back to a visitor. 

Image

While this level of detail can be useful for various ad hoc statistical analysis, it also means that the experimentation system has less privacy control since all the information about a person is linked back to each experiment. 


One can use pseudonymization, where the explicitly identifiable information (the Name, Email, and often Cust ID) can be removed from the table. However, what many fail to realize is that even if we remove those fields but keep all of the other associations at the same individual level, the remaining data often still contains more information than required and might be at a higher risk of being able to leak personal information about individuals. 

Happily, it turns out that for most standard experiments there is no need to collect or store data at the individual level to run the required statistical procedures for AB Tests – or even for certain versions of regression analysis useful for things like AB Test interaction checks. Instead of collecting, linking, and storing experiment data per individual, Conductrics collects and stores experiment data that we both de-identify AND aggregate AS IT IS COLLECTED. This makes it possible to both collect and store the experimental data in an aggregate form such that the experimentation platform NEVER needs to know identifying individual level data. 

Privacy by Design: Data Minimization and Aggregation

In the context of privacy engineering, network centricity (“the extent to which personal information remains local to the client”) is considered a key quality attribute in the Privacy by Design process. This can be illustrated by contrasting so-called “global privacy” with “local privacy”. 

In the global privacy approach identifiable, non minimized data is collected and stored, but only by a trusted curator. For example, the US Gov’t collects census data about US citizens. The US Census Bureau acts as the trusted curator, with access to all of the personal information collected by the census. However, before the Census Bureau releases any data publicly, it applies de-identification and data minimization procedures to help ensure privacy. 

Local privacy, by contrast, is a stronger form of privacy protection because data is de-identified and minimized as it is collected and stored. This removes the need for a trusted curator. Conductrics is designed to allow for a local privacy approach by default, such that Conductrics only collects and stores data in its minimized form.

In the process of doing so, Conductrics is also respecting the key privacy engineering objective of dissociability – a key pillar of the NIST Privacy Framework. 

How does this data collection work?

Rather than link all of the experiments back to a common user in a customer table / relational model above, Conductrics stores each experiment in its own separate data table. For simple AB Tests each of these tables in turn only need to record three primary values for each treatment in the experiment: 1) The count of enrolments (the number of users per treatment); 2) The total value of the conversions or goals for each treatment; and 3) the total value of the square of each conversion value. Let’s take a look at a few examples to make this clear. At the start of the experiment the AB Test’s data table is empty.

AB Test 1

Image

As users are assigned to treatments, Conductrics receives telemetry from each user’s client (browser) with only the information needed to update the data table above. For example, say a customer on the client website gets assigned to the ‘B’ treatment in the AB Test. A message is sent to Conductrics (optionally, the messages can be first passed to the organization’s own servers via Conductrics Privacy Server for even more privacy control).

This message looks something like ‘ABTest1:B’ and the AB Test’s data table in Conductrics is updated as follows:

Image

If the user then purchases the product attached to the test, the following message is sent ‘ABTest1:B:10’. Conductrics interprets this as a message to update the Sales field for Treatment B by $10 and the Sales^2 field by 100 (since 10^2=100). Notice that no visitor identifier is needed to make this update (Note: The actual system is a bit more complex, ensuring that the Sales^2 records properly account for multiple conversion events per user, but this is the general idea.)

Image

As new users enter the test and purchase, the AB Test’s data table accumulates and stores the data in its minimized form. So by the end of our experiment we might have a data table that looks like this:

Image

A nice property of this is that not only has the data been collected and stored in a minimized form for increased privacy, but it is also in a form that is much more efficient to calculate statistical tests. This is because most of the required summation calculations that are required for things like t-tests and covariance tables have already been done. 

Interestingly we are not limited to just simple AB Tests. We can extend this approach to include additional segment data. For example if we wanted to analyze the AB Test data based on segments – say built on customer value levels; Low (L) ,Medium (M),and High (H), the data would be stored as follows.

Image

There is of course no need to limit the number of segments to just one. We can have any number of combinations of segments. Each combination is known as an equivalence class. As we increase the segment detail of each equivalence classes we also increase the number (based on the cardinality of the segment combinations).

So as the number of classes increase, there is an associated increase the possibility of identifying or leaking information about persons entered into a test. To balance this, Conductrics collection of user traits/segments follows from ideas of K-Anonymization, a de-identification technique based on the idea that the collected user data should have groups of at least K other users who look exactly the same. Depending on each experiment’s context and sensitivity, Conductrics can either store each user segment/trait group in its own separate data table, effectively keeping the segment data de-linked, or store the data at the segment combination level.

This gives our clients the ability to decide how strict they need to be with how much the data is aggregated. In the near future Conductrics will be adding reporting tools that will allow clients to query each experiment to help manage and ensure that data across all of their experiments is stored at the appropriate aggregation level.  

What about the Stats? 

While statistics can be very complicated, calculations behind most of the common approaches for AB Testing ( e.g  Welch t-tests. z-tests, Chi-Square, F-Tests, etc.) under the hood are really mostly just a bunch of summing and squaring of numbers. 

For example, the mean (average) value for each treatment is just the sum of Sales divided by the number of enrollments for each treatment. By dividing the sales column by the count column for each treatment we can calculate the average conversion value per treatment. 

The calculations for the variance and standard errors are a bit more complicated but they use a version of the following general form for the variance which uses the aggregated sum of squares data field (where each value is squared first then those squared values are all added up):

Image

It turns out that this approach can be generalized to the multivariate case, and using similar logic, we can also run regressions required for MVTs and interaction checks. Technical readers might be interested to notice that the inner product elements of the Gram Matrix for ANOVA/OLS with categorical covariates are just conditional sums that we can pluck from the aggregated data table with minimal additional calculations.

Intentional Data Collection and Use

Of course there are use cases where it is appropriate and necessary to collect more specific, and identifiable information.  However, it is often the case that we can answer the very same questions without ever needing to.  The main point is rather than collecting, linking, and storing all of the extra information by default just in case it might be useful, we should be intentional for each use case about what is actually needed, and proceed from there.

Lastly, we should note that disassociation methods and data minimization by default are not substitutes for proper privacy policies – perhaps one could argue that alternative approaches, such as differential privacy might be, but generally the types of methods discussed here are not). Rather, privacy engineering is a tool that sits alongside required privacy and legal compliance policies and contracts.

If you would like to learn more about Conductrics please reach out here. 

Posted in Experimentation, Privacy by Design, Uncategorized | Leave a comment


Introducing Conductrics Market Research

The Fusion of Experimentation with Market Research

Customer centric 

For over a decade Conductrics has been providing innovative software for online Experimentation and Optimization. Innovations include the industry’s first API driven A/B Testing and multiarmed bandit software, as well as the first to introduce transparency in our machine learning predictive targeting with human-interpretable contextual bandits capabilities.

Working alongside our client partners, it became clear that even though tools for experimentation and optimization are extremely powerful, up until now they have been inherently limited.   Limited because no matter the type of A/B Test or ML algorithm, experimentation has lacked visibility into a key, and necessary, source of information – the voice of the customer. 

We are excited to announce that we have created Conductrics Market Research a first of its kind solution that integrates Optimization with Market research. Current approaches require separate tools and treat experimentation and research as separate solutions. We believe the true power of customer experience optimization can be only unlocked when experimentation and research are treated as one, like a film and its soundtrack. Full understanding and meaning can only happen when both are perfectly synced with one another.  

Top Level Benefits of combining research with experimentation and optimization include:

  1. Learn directly from the customer about what they care about and their unmet needs in order to feed your experimentation program and to drive drive the fruitful development of new product and new customer experiences.
  2. Now you can learn not only ‘What’ work, but ‘Why’ it works, by adding direct customer feedback alongside customer behavior in your A/B Test metrics. 
  3. Discover if new customer experiences and product features improve customer attitudes and long term loyalty (e.g. NPS) as well as improve sales and conversions.
  4. Tailor the customer’s  journey in real time and show them that you are actually listening to them, by delivering real-time customized online experiences based on their specific survey feedback.
  5. Strengthen your culture of experimentation by improving internal messaging by combining direct customer quotes and your tests’ impact on NPS alongside your current statistical reporting. 

New Platform Capabilities

  • Easy Set up and Launch of Native Surveys directly from Conductrics
  • Connect any A/B Test to any Survey: 
    • Numeric and Yes/No survey responses can be used directly as goals for A/B Test.
    • Collect and connect qualitative/open text customer responses back to each A/B Test treatment experience. 
  • Append in-session user data (e.g logged in, loyalty status, A/B test treatments etc.) to survey response data for enhanced survey reporting.
  • Create in-session user traits directly from survey responses and attach targeting rules to them to customize online user experience in real-time or to run targeted A/B tests.
  • Attach any standard behavioral goals, such as sales, to surveys to auto-generate A/B Tests to determine if offering the survey adversely affects sales or conversions.  

Conductrics Market Research

As we roll out the new integrated platform, customers will gain access to Conductrics Market Research and see it as a new top-level capability along side A/B Testing, Predictive Targeting, and Rule-Based Targeting.

Image


For over a decade, Conductrics has been innovating and delivering industry-first capabilities. We are very excited to be the first to combine direct voice of consumer data alongside traditional experimentation data to provide you with the integrated capabilities needed to create better user experiences, drive long-term loyalty and increase direct revenue.

Get a first look at some of the unique capabilities that are available to your experimentation and research teams that are rolling out at Conductrics. 

To learn more contact us here.

Posted in Experimentation, Survey, Uncategorized | Leave a comment


Conductrics Market Research Features

A First Look

In this post we will take our first look at some of the new features the Conductrics Market Research release. We will follow up over the coming weeks and months with more peeks and details of the new capabilities. 

As we roll out the new integrated platform, customers will gain access to Conductrics Market Research and see it as a new top-level capability along side A/B Testing, Predictive Targeting, and Rule-Based Targeting.

Image

When creating a new survey, along with the standard survey creation options, there are three primary additional features that are unique to Conductrics. 

1 Survey Responses as A/B Test Goals

When creating a numeric survey question you will be given the option to ‘Track as a Goal/Conversion’ event. If this option is selected then the value of this question can be used as a goal in any of your A/B Tests – just like any other behavioral measure.   

For example, say we have a three question survey and we would like to capture ‘How Likely To Recommend’ as a survey response, but we would also like to see how an upcoming A/B Test might affect the likelihood to recommend. By clicking the option to track the Recommend question as a goal, all new A/B Tests will be eligible to use this survey response as a conversion goal.

Image

2 Auto Create NPS Goal

While any metric survey question can be used as an A/B Testing goal, often what the C-Suite really cares about is changes to NPS. By also selecting the optional ‘Enable for Net Promoter Score (NPS)’ as shown in the image above, Conductrics will auto create 4 NPS related goals:

  1. NPS score (% Promoters – % Detractors)*100
  2. Number Promoters
  3. Number Detractors
  4. Number of Passives. 

What is so powerful about this is that you can now see NPS scores, and their associated confidence intervals and testing statistics, in your A/B Testing reports along with your sales and conversion goals.

Image

We believe this is the only survey solution, even including dedicated survey tools, that provides confidence intervals around NPS and the ability to use NPS in A/B Tests.

3 Real-Time Customer Experience Customization 

As part of the Survey creation workflow there is also the option of assigning survey responses as user traits for filtering and enriching reporting for A/B Tests, or to creating real-time customized in-session customer experiences.

For example, if we wanted to customize the customer experience based on how a user responded to the “What is the Purpose of Your Visit?” question, we just select the ‘Retain Response as Visitor Trait’ in the question setup and the value of ‘Purpose of Visit’ will automatically be sent into an in-session Conductrics visitor trait ‘Purpose’

Image

This makes this information immediately available to all reporting, A/B Testing, and Predictive Targeting modules within Conductrics.


To customize the in-session experience we can use Conductrics Rules-Based Targeting module. Once the above survey is saved it will auto-populate Conductrics User Targeting Conditions builder.  Below we see that the rules builder auto generated a user trait called ‘Purpose’ that has the four associated survey response values as options.  These can be used either directly or in any logical combination with any other set of in-session visitor traits.

Image

To keep it simple, we set up a collection of rules that will trigger the relevant in-session user experience based on just the user’s responses to the ‘Purpose of Visit’ question. In the follow screen shot, we show our variations, or user experiences, on the left, and on the right we have our targeting rules that will trigger and deliver the experiences based on the user’s response to the ‘Purpose of Visit’ question. These user experiences can be content from Conductrics web creation tools, backend content like feature flags, or even different server side algorithms.

Image

For example if a customer submits a survey and answers the ‘What is the Purpose of Your Visit?’ question with ‘To Purchase Now’’, then they will immediately be eligible for the targeting rule that will deliver ‘Product Offers’ content. 

Survey Response Data

Of course, Conductrics Research also provides survey reporting to aide human decision making. Conductrics provides simple to use filtering and summary features to help you more easily understand what your customers are hoping to communicate with you.

Image

Along with the tabular view, there is also a card view, so that you can ‘flip through’ individual survey responses and see all an individual customer’s responses enriched with all of their associated in-session data that has been made available to the Conductrics platform.

Image

Optionally, you can download the in-session enriched survey data for use in your favorite statistical software package.

Are Surveys Affecting Conversions?

An important question that arises with in-session market research is if offering a survey in a sensitive area of the site might adversely affect customer purchase or conversion. Conductrics provides the answer. Simply assign a behavioral conversion goal, like sales, or sign-up, to the survey. Conductrics will automatically run a special A/B Test alongside the survey to test the impact that offering a survey has on conversion by comparing all eligible users who were offered a survey vs those who were not offered.

Image

Now your market research teams can learn where and when it is okay to place customer surveys by determining if conversions actually are affected and if so, if it is by a large enough amount to offset the value of direct customer feedback.

For over a decade, Conductrics has been innovating and delivering industry-first capabilities. We are very excited to be the first to combine direct voice of consumer data alongside traditional experimentation data to provide you with the integrated capabilities needed to create better user experiences, drive long-term loyalty and increase direct revenue. This is just a first quick look at some of the unique capabilities that are available to your experimentation and research teams that are rolling out at Conductrics. 


To learn more contact us here.

Posted in Experimentation, Privacy by Design, Uncategorized | Leave a comment


AB Testing: Ruling Out To Conclude

Seemingly simple ideas underpinning AB Testing are confusing. Rather than getting into the weeds around the definitions of p-values and significance, perhaps AB Testing might be easier to understand if we reframe it as a simple ruling out procedure.

Ruling Out What?

There are two things we are trying to rule out when we run AB Tests

  1. Confounding
  2. Sampling Variability/Error

Confounding is the Problem Random Selection is a Solution

What is Confounding?

Confounding is when unobserved factors that can affect our results are mixed in with the treatment that we wish to test. A classic example of potential confounding is the effects of education on future earnings. While people who have more years of education tend to have higher earnings, a question Economists like to ask is if extra education drives earnings or if natural ability, which is unobserved, causes how may years of education and amount of earnings people receive. Here is a picture of this:

Image
Ability as Confounder DAG

We want to be able to test if there is a direct causal relationship between education and earnings, but what this simple DAG (Direct Acyclic Graph) shows is that education and earnings might be jointly determined by ability – which we can’t directly observe. So we won’t know if it is education that is driving earnings or if earnings and education are just an outcome of ability.

The general picture of confounding looks like this:

Image
General DAG

What we want is a way to break the connection between the potential confounder and the treatment.

Randomization to the Rescue
Amazingly, if we are able to randomize which subjects are assigned to each treatment we can break, or block, the effect of unobserved confounders and we can make causal statements about the treatment on the outcome of interest.

Image
Randomization breaks Confounding

Why? Since the assignment is done based on random draw, the user, and hence any potential confounder is no longer mixed in with the treatment assignment. You might say that the confounder no longer gets to choose its treatment. For example, if we were able to randomly assign people to education, then high and low ability students each would be just as equally likely to be in the low and high education groups, and their effect on earnings would balance out, on average, leaving just the direct effect of education on earnings. Random assignment lets us rule out potential confounders, allowing us to focus just on the causal relationship between treatment and outcomes*.

So are we done? Not quite. We still have to deal with uncertainty that is introduced whenever we try to learn from sample observations.

Sampling Variation and Uncertainty

Analytics is about making statements about the larger world via induction – the process of observing samples from the environment, then applying the tools of statistical inference to draw general conclusions. One aspect of this that often goes underappreciated is that there is always some inherent uncertainty due to sample variation.  Since we never observe the world in its entirety, but only finite, random samples, our view of it will vary based on the particular sample we use. This is reason for the tools of statistical inference – to account for this variation when we try to draw out conclusions.

A central idea behind induction/statistical inference is that we are only able to make statements about the truth within some bound, or range,  and that bound only holds in probability.

For example, the true value is represented as the little blue dot But this is hidden from us.

Image
Truth

Instead what we are able to learn is something more like a smear.

Image
We Learn in Smears

The smear tells us that the true value of the thing we are interested in will lie somewhere between x and x’ with some P probability. So there is some P probability, perhaps 0.05, that our smear won’t cover the true value.

Image
Truth not under Smear

This means that there are actually two inter related sources of uncertainty:

1) the width, or precision, of the smear (more formally called a bound)

2) the probability that the true value will lie within the smear rather than outside of its upper and lower range.

Given a fixed sample (and a given estimator), we can reduce the width of the smear (make it tighter, more precise), only by reducing the probability that the truth will lie within it  – and vice versa, we can increase the probability that the truth will lie in the smear only by increasing (make it looser, less precise) its width. This is a more general concept that the confidence interval is an example of – we say the treatment effect is likely within some interval (bound) with a given probability (say 0.95). We will always be limited in this way. Yes we can decrease the width, and increase the probability that it holds by increasing our sample size, but it is always with diminishing returns [in the order of O(1/sqrt(n)].

AB Tests and P-values To Rule Out Sampling Variations

Assuming we have collected the samples appropriately, and certain assumptions hold, by removing potential confounders there will now be just two potential sources of variation between our A and B interventions:

1) the inherent sampling variation that is always part of sample based inference that we discussed earlier; and
2) a causal effect – the effect on the world that we hypothesize exists when doing B vs A.

AB tests are a simple, formal process to rule out, in probability, the sampling variability.  Through the process of elimination if we rule out the sampling variation as the main source of the observed effect (with some P probability), then we might conclude the observed difference is due to a causal effect. The  P-value ( the probability of seeing the observed difference, or greater, just due to random sampling) – relates to the probability that we will tolerate in order to rule out that the sampling variation is a likely source for the observed difference. 

For example, in the first case we might not be willing to rule out sampling variability, since our smears overlap with one another – indicating that the true value of each might well be covered by either smear.

Image
Don’t Rule Out Sampling Error

However in this case, where our smears are mostly distinct from one another, we have little evidence that the sampling variability is enough to lead to such a difference between our results and hence we might conclude the difference is due to a causal effect.

Image
Result unlikely due to Sampling Error Alone – Rule Out

So we look to rule out in order to conclude**

To summarize, causal statements, via AB Tests/RCTs, randomize treatment selections to generate random samples from each treatment in order to block confounding so that we can safely use the tools from statistical inference to make causal statements .

Image

* RCTs are not the only way to deal with confounding. When studying the effect of education on earnings, un able to run RCTs, Economists used the method of instrumental variables to try to deal with confounding in observational data.

**technically ‘reject the null’ – think of Tennis if ‘null’ trips you up – it’s like zero. We ask ‘Is there evidence, after we account for the likely difference due to sampling’ to reject that the difference we see, e.g the observed difference in conversion rate between B and A, is likely due to just sampling variations.

***If you want to learn about other ways of dealing with confounding beyond RCTs a good introduction is Causal Inference: The Mixtape – by Scott Cunningham.

Posted in Experimentation, Uncategorized | Leave a comment