Efficiency Track
Manage Production Improvements by Eliminating Process-Specific Waste
Monitor your most critical part numbers and correct them before it’s too late.
Tackle Job-Specific Challenges
The Efficiency Track helps you prioritize jobs that exceed quoted targets for cycle or setup time, pinpoint prolonged unplanned stoppages, and identify machine capacity. With powerful reports that drill down into performance data, you will gain the insight needed to drive operational process improvements, eliminate bottlenecks & hit your efficiency goals.
Key Benefits
- Identify Jobs at Risk
- Analyze Machine Efficiency & Available Capacity
- Address Common Downtime Reasons
- Track Overall Equipment Effectiveness (OEE) Trends
- Communicate Goals to Production Leads
Capacity Used Report
▼
Don’t simply purchase another machine or increase the size of your facility without understanding your true capacity and how to measure it. The Capacity Used report assesses the utilization of your equipment by scheduled shifts or 24/7 operation. With this powerful report, you’ll determine how much capacity is available for new jobs, whether you need to add another shift, or help to identify opportunities to optimize existing workflows to minimize downtime. Delivered daily via email, this report keeps leadership informed with a quick, actionable snapshot of how your facility is leveraging its available capacity so you can make smarter, more profitable decisions.
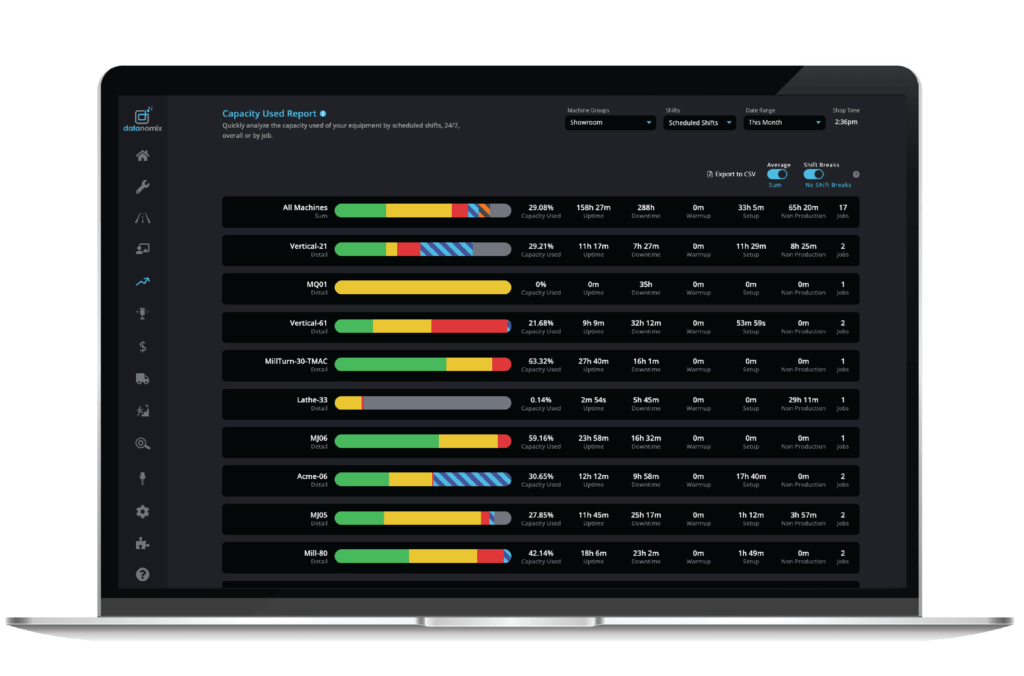
CAPACITY USED REPORT
Quickly analyze the capacity used of your equipment by scheduled shifts, 24/7, overall or by job.
Continuous Improvement Hub
▼
Boardroom-ready KPIs at your fingertips! The CI Hub provides business leaders and continuous improvement personnel with real-time insights into overall factory performance to drive efficiency and profitability. This dashboard tracks key metrics like machine efficiency (utilization, capacity used, uptime, setup/changeover, waste, and downtime) as well as machine cycle time (Takt Performance). This allows you to swiftly track and identify top-performing jobs or shifts and opportunities for improvement.
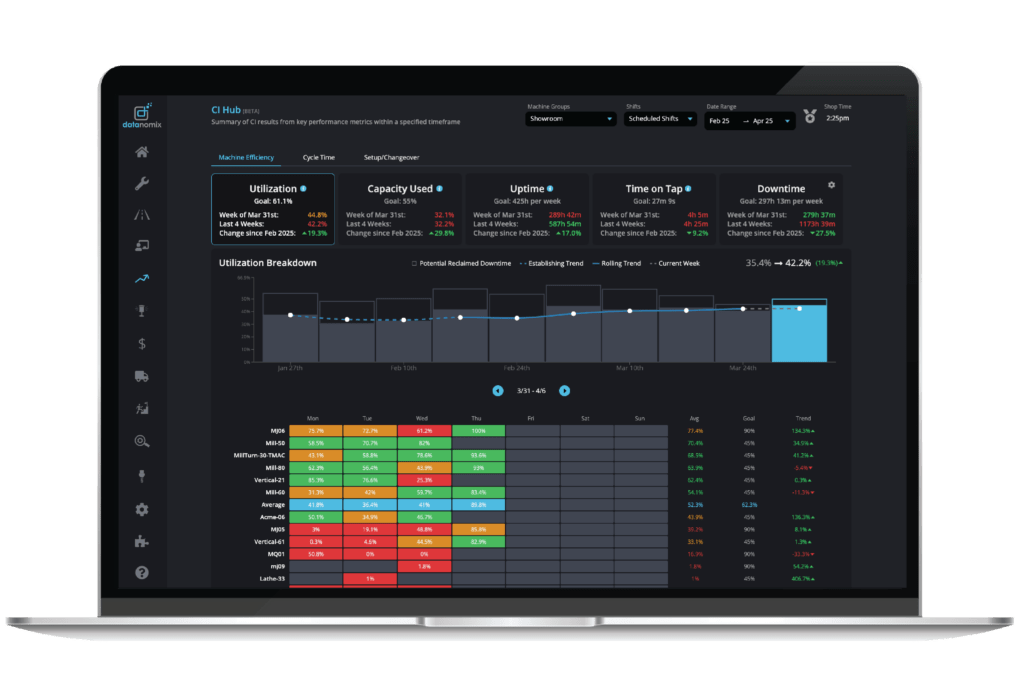
CONTINUOUS IMPROVEMENT HUB
Summary of CI results from key performance metrics within a specified timeframe.
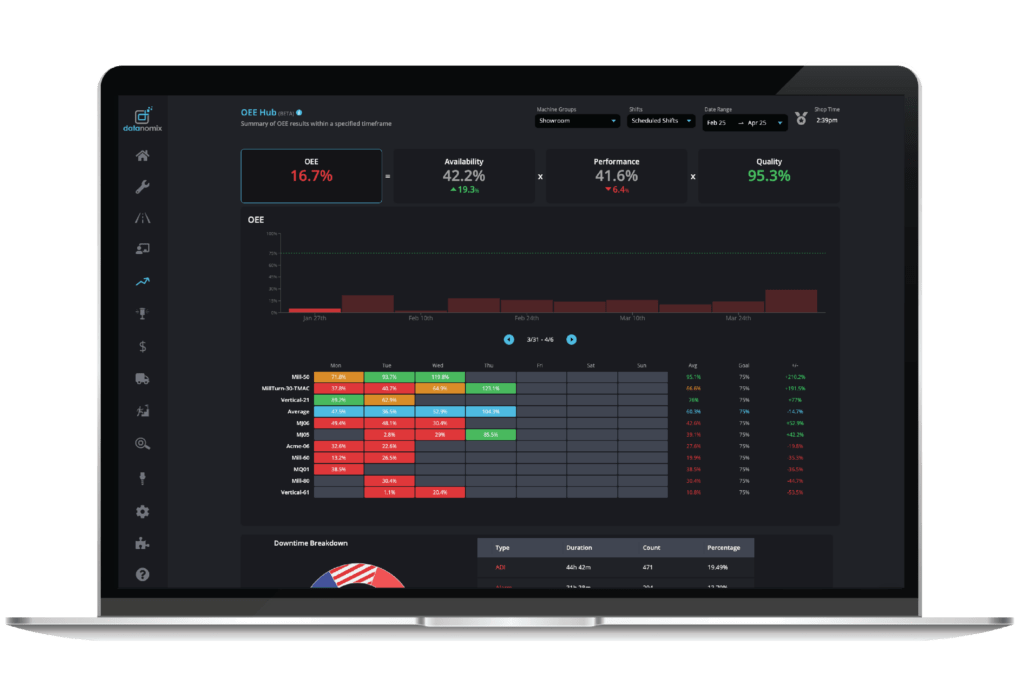
OEE Hub
▼
Gain a clear, data-driven view of your weekly Overall Equipment Effectiveness (OEE) and uncover what operational or process changes are needed to achieve your goals. The OEE Hub displays machine availability based on utilization and cycle time achievements in relation to your capability (Takt Performance) and part quality to track part conformance. Pinpoint downtime causes by shift or machine to boost uptime & drive continuous improvement.
Summary of Overall Equipment Efficiency results.
Downtime Report
▼
Unplanned downtime is one of the biggest profit killers in manufacturing, yet too many shops rely on memory or manual notes to track it. When employees multitask or operate multiple machines, critical details slip through the cracks. Real-time insights are crucial to understanding job performance & it’s essential to have a digital method for tracking downtime. Datanomix Downtime Insights offers visibility into the most common causes of lost productions so you can take action fast. Analyze downtime trends by any dimension—machine, shift, or time frame. Drill into Pareto alarms, setup/changeover, and out-of-service events to uncover where you are losing the most uptime.
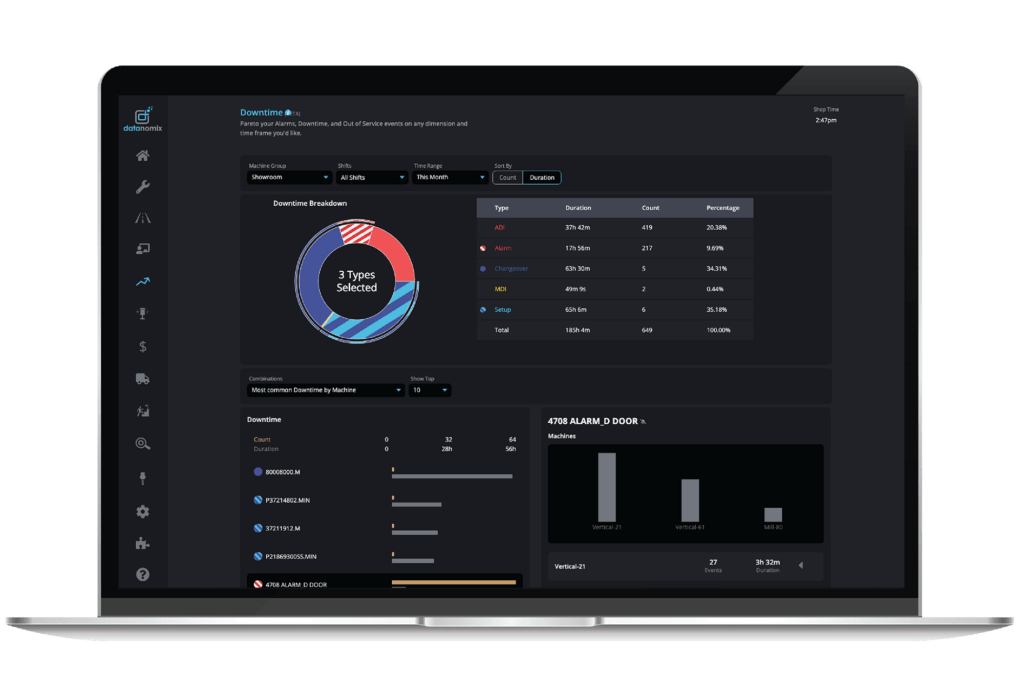
Pareto your Alarms, Downtime, and Out of Service events on any dimension and time frame you’d like.
EFFICIENCY TRACK CONTINUOUS IMPROVEMENT HUB
CAPACITY USED REPORT
Quickly analyze the capacity used of your equipment by scheduled shifts, 24/7, overall or by job.
CONTINUOUS IMPROVEMENT HUB
Summary of CI results from key performance metrics within a specified timeframe.
Summary of Overall Equipment Efficiency results.
Pareto your Alarms, Downtime, and Out of Service events on any dimension and time frame you’d like.
“It’s key that we know how efficient we are because we’re competing with the best companies in the world. Our strategy is to buy the latest and greatest equipment and monitor them to make sure we are as efficient as we can be to get some of the work back that has gone overseas.”
Jack Russell, Owner
Rolar Products | Muskegon, MI
Win the Window
Operations Managers use this report to facilitate weekly or daily huddles with the team. It helps identify areas where support is needed, implement process improvements, and apply wins from one area across the shop.
