Tracking query progress with Live Query Statistics

How frustrating is it, to run a query on a database and it seems to be “stuck”. We’ve all seen that happen right? But how can you tell what the problem is, without letting the query complete (which could take a long time)? Microsoft (or actually the SQL Server team) gave us a new toy to play with that can help us in situations like this, and this tool is called “Live Query Statistics”.

 
Creating resources
To show you how the Live Query Statistics work, let’s create a sample table first, and insert 1.000 rows:

CREATE TABLE LiveQueryStats
	(ID INT IDENTITY(1,1),
	 VALUE VARCHAR(10))
GO

INSERT INTO LiveQueryStats
	(VALUE)
VALUES
	('X')
GO 1000

 
Because we want to actually see something happen, let’s multiply the number of rows coming from the single table by using the query below:

SELECT *
FROM LiveQueryStats T1
CROSS APPLY LiveQueryStats T2
CROSS APPLY LiveQueryStats T3

 
The query will return 1 billion rows (1.000.000.000), and will run for a while. This gives you the opportunity to look at the different features without rushing or losing your running query.

 
Live execution plan
Before running the query above, you need to enable the Live Query Statistics just like you would do to the normal execution plan. This is an extra button added in the SQL Server 2016 SSMS (and the downloadable version of course). When that’s enabled, you can execute the query, and SQL Server Management Studio (SSMS) will automatically switch to the live execution plan.

In this execution plan, you’ll see the data flow through the components, so you can actually see what SQL Server is doing at a specific moment:

Image

 
Query completion percentage
Another great addition is the overall completed percentage, that you can find at the bottom of your SSMS. This shows you the percentage of completion, that can help you estimate the time till completion:

Image

 
Live rowcount
The properties window normally shows you the in-depth information of your query after completion (number of threads, memory grant, etc). With the live execution plan enabled, it can provide you with real-time statistics as well:

Image

 
Live execution plan from Activity Monitor
From the Activity Monitor you can also open the live execution plan of running queries on your instance. In the Activity Monitor, you have an additional tab in SQL Server 2016 called “Active Expensive Queries”. In this tab you can right-click on a running query, and click on “Show Live Execution Plan”. This opens a new tab in SSMS with the execution plan:

Image

 
Unfortunately this only works for queries that have the live statistics enabled before execution. I don’t expect this to change in the final product, mainly because of the negative performance impact this feature can have on your queries and instance.

 
Drawbacks, Limitations and Bugs
Because this is only a CTP version of SQL Server 2016, we can expect some bugs and limitation, so I’ll be the last one to judge. And I don’t think these limitations are a big drawback on the feature.

One of these bugs is a crashing SSMS. If you open a live execution plan from the Activity Monitor, and close that tab, SSMS crashes every now and then.

Image

 
Another weird thing is that exiting SSMS by clicking on the close button (top right) when the live execution plan is open, causes the list of recently used SQL Servers (the list used when connecting object explorer for example) to be cleared for some reason.

This behavior is reproducible, so I think this is a small bug in SSMS, or the fact that I upgraded this instance from the first CTP version till the current version. But I’m sure this will be fixed by the SQL Server Team in the next releases.

 
The biggest pitfall (in my opinion) of this feature is also mentioned in the documentation. This feature is “primarily intended for troubleshooting purposes” and “can slow the overall query performance”. And I know, it look SO COOL to have this on all queries you’re running, but please be careful with this. Don’t enable this on every running query, but only use this to debug issues!

Another limitation for this feature (at least at the moment I’m writing this), is the use in combination with columnstore indexes, memory optimized tables and natively compiled stored procedures. You can read more about this here.

And I shouldn’t even have to mention this, but remember: you can only use Live Execution Plans when you have SHOWPLAN permissions on the database (same permissions you need to view normal execution plans).

 
Alternatives
One of the questions I had when I read about this: are there any alternative for this? One of the only things that come to mind is the “Track My Query” tool, written by Matan Yungman (Blog | @MatanYungman). This tool allows you to monitor your query, and it will show you what part of your query is currently running. For more in-depth information, I recommend the SQLBits session where he explains the inner-workings of this tool. I’ve seen this session in person, and it was an interesting session.

 
Conclusion
With all these awesome new features that will be shipped in SQL Server 2016, I think there’s a whole new way of looking at SQL Server as a product. I’ve always liked working with SQL Server, but this version is taking it to the next level.

With all these new features, debugging issues is going to be a bit easier, developing new stuff is going to be faster, and the overall usability is going to skyrocket. I can’t wait to get my hands on the finished product!

Searching through the SQL Server error logs

SQL Server has a number of error logs, where both informational messages and errors are logged. You can compare it to the event viewer in Windows, but than only for SQL Server. This error log contains a lot of potentially useful information when you’re investigating an issue.

The physical location of the logfiles is “C:\Program Files\Microsoft SQL Server\MSSQL12.[InstanceName]\MSSQL\Log”. This can also be different if you changed the path in the SQL Server setup (for example, the path on my machine is: “C:\Program Files\Microsoft SQL Server 2014\MSSQL12.[InstanceName]\MSSQL\Log”). In that directory you’ll find a number of ERRORLOG.[Number] files. There is a file for every archive, which depends on your SQL Server configuration. You can open the files with notepad, or any other text-editor you like.

But you can also access these archives from SQL Server Management Studio (SSMS).

 
SQL Server Logs
If you connect the object explorer in your SSMS, you can navigate to Management -> SQL Server Logs. There you see the number of configured log files (default is 7 log files: 6 archives + current log file):

Image

 
You can double-click a log file to open it. In the pop-up window you see the contents of the log, a number of checkboxes on the left to add more archives to the current view, and a button called “Filter…” that you can use to filter the current view:

Image

 
But unfortunately the filter in the Log File Viewer isn’t always as easy to use. For example, you can’t (at least as far as I know) filter on 2 strings. So how are you going to look for any events that contains “Backup” or “Restore”? That’s not possible with this filter.

 
xp_readerrorlog
If you would rather use T-SQL to find things in the SQL Server Error Log, that’s also possible. There’s an extended procedure called xp_readerrorlog you can use for that, or you can use sp_readerrorlog (which is a stored procedure that used xp_readerrorlog).

If you use sp_readerrorlog or xp_readerrorlog, you can also apply filters. You can use a number of parameters to filter the output, but you can only do so on 1 singe log file:

EXEC xp_readerrorlog
	0,						--ArchiveID (First error log = 0)
	1,						--Log type (SQL Server = 1, SQL Agent = 2)
	N'Backup',				--Filter ProcessInfo
	N'Sandbox',				--Filter Text
	'20150826 00:00:00',	--DateFrom
	'20150828 10:32:00',	--DateTill
	'ASC'					--Sort order

 
By altering the filter-parameters (or leave them empty), you can search through the SQL Server error log or the SQL Server Agent error log, and you can do so on a number of columns and variables (like datetimes). But you still have the same issue you had with the log viewer in SSMS: you can can only search on 1 filter, and you can’t search through more than 1 archive at the same time. So how can we solve that?

 
Search trough multiple archives
Searching through multiple log files might come in handy if you’re not sure if the database was taken offline today or last week. Or if you’re not sure if the problem occurred before or after a log file cycle.

One way of doing this (which I use on a regular basis, and I blogged about earlier), is by inserting all the log information in a temporary table and search through that results:

DECLARE @SSEL TABLE
	(LogDate DATETIME,
	 ProcessInfo VARCHAR(100),
	 Text VARCHAR(MAX))

/* Insert current log */
INSERT INTO @SSEL
EXEC xp_readerrorlog 0

/* Insert previous log */
--INSERT INTO @XREL
--EXEC xp_readerrorlog 1

SELECT
	SSEL.LogDate,
	SSEL.ProcessInfo,
	SSEL.Text
FROM @SSEL AS SSEL
WHERE SSEL.Text LIKE '%Backup%'
ORDER BY SSEL.LogDate ASC

 
The only issue with this is that you need to find out how many log files you need to insert into the temporary table (if you want to search through all available logs). But you can also find the answer to that question with a query.

 
Number of configured logs
You can configure the amount of error logs from SSMS. If you right-click on the SQL Server Logs in the object explorer, you can click on Configure:

Image

 
In the pop-up window, you can configure the amount of archives:

Image

 
If you script out that change, you’ll end up with this script:

USE master
GO

EXEC xp_instance_regwrite
	N'HKEY_LOCAL_MACHINE',
	N'Software\Microsoft\MSSQLServer\MSSQLServer',
	N'NumErrorLogs',
	REG_DWORD,
	10
GO

 
So you can use the same method (but in reverse of course) to find the amount of configured logs. You just need to use the xp_instance_regread (blogged about this before) stored procedure:

DECLARE @NumErrorLogs int

EXEC master.dbo.xp_instance_regread
	'HKEY_LOCAL_MACHINE',
	'SOFTWARE\Microsoft\MSSQLServer\MSSQLServer',
	N'NumErrorLogs',
	@NumErrorLogs OUTPUT

SELECT @NumErrorLogs AS [NumberOfLogFiles]

 
There are 2 results possible from this:

– NULL: This means the setting is not configured, and the default (6 archives) is used
– An integer between 6 and 99: This means the amount of logs is configured and not set to default. The number that is returned is the amount of archives

 
This result can be used to configure the amount of inserts in the script posted above. If a NULL is returned, you know you need to use the default setting of 6. If an integer is returned, you can use that number to determine the amount of archives you’d like to use.

 
Conclusion
By retrieving the SQL Server error log with a T-SQL query, it’s easy to automate this process if needed. For example, you might want to store the error log data in another place, and not keep it stored in the log files on your instance. You can do that by modifying this script, or write your own solution. By using the xp_instance_regread and xp_readerrorlog or sp_readerrorlog, you can be sure your script doesn’t fail or misses some data.

Where to find backup- and restore history

Interesting questions don’t always need to be hard to answer. Earlier this week I was asked “How can I see what backup was restored on environment X?”. The answer is as interesting as the question…

 
Backup
To see what backups are taken, you can take a look at the history of your maintenance job (depending on whatever type you use in your environment). But there is another way: just ask SQL Server.

First, let’s create a new database named Sandbox (before you run the scripts in this blog post, change or create the directories that are used!):

USE master
GO

CREATE DATABASE Sandbox
	ON PRIMARY (NAME = N'Sandbox', FILENAME = N'C:\Database\Sandbox.mdf', SIZE = 4096KB, FILEGROWTH = 1024KB)
	LOG ON (NAME = N'Sandbox_log', FILENAME = N'C:\Database\Sandbox_log.ldf', SIZE = 1024KB, FILEGROWTH = 1024KB)
GO

 
Before we start to backup this database, I want to make sure the information I see is only for this backup. In order to do so, I’m going to cycle the SQL Server error log, and clean all my backup history from msdb. You can do that by running these statements:

EXEC sys.sp_cycle_errorlog
EXEC msdb.dbo.sp_delete_backuphistory @oldest_date =  '2016-01-01'

 
By setting the “@oldest_date” to a date in the future, all backup history will be deleted.

Now that we’ve done that, let’s take a backup of our database:

BACKUP DATABASE [Sandbox]
 TO DISK = N'C:\Database\Backup\Sandbox_2010828_0832.bak' WITH STATS = 10;
GO

 
The backup will complete in an instant, because there is no data to backup:

Image

 
The result of the backup can be found in 2 locations. The first one is the SQL Server error log:

EXEC xp_readerrorlog

 
If you search in the error log you can find the exact time the backup was taken, the amount of pages that were processed, the location of the backup file, etc (image clickable for larger version):


Image

 
The SQL Server error logs are also available from the SQL Server Management Studio (SSMS). If you connect to your instance with the object explorer, and navigate to Management -> SQL Server Logs, you can find the same information.

The second location you can use to retrieve this information is msdb. The msdb contains the history of your backups:

Image

 
You can retrieve this information by running a query on the backup-tables:

SELECT
	B.user_name,
	B.database_name,
	M.physical_device_name,
	B.backup_start_date,
	B.backup_finish_date,
	CASE B.type
		WHEN 'D' THEN 'Database'
		WHEN 'L' THEN 'Log'
	END AS BackupType
FROM msdb.dbo.backupset B
INNER JOIN msdb.dbo.backupmediafamily M ON M.media_set_id = B.media_set_id

 
Restore
The information for restored backups can also be found in the same 2 locations. Let’s take a backup of the Sandbox database first:

USE master
GO

RESTORE DATABASE Sandbox
FROM DISK = N'C:\Database\Backup\Sandbox_2010828_0832.bak' WITH REPLACE, STATS = 10
GO

 
If we look at the SQL Server error log again we can find the restore time, used backup, etc:


Image

 
We can also query the msdb again. But this time, we need to use the restore-tables:

SELECT
	destination_database_name,
	user_name,
	restore_date,
	destination_phys_name
FROM msdb.dbo.restorehistory H
INNER JOIN msdb.dbo.restorefile F ON F.restore_history_id = H.restore_history_id

 
This shows you all recent restores on your instance:

Image

 
Conclusion
Being able to retrieve the information you need to determine which database was backed-up or restored can help you solve some weird issues. In my case, it explained why a certain record wasn’t restored on environment X: it was inserted after the backup was taken. Issues like that can be quite hard (or even impossible) to find without information about backups and restores.

Minimal permissions needed to run sp_WhoIsActive

If you’re running sp_WhoIsActive on your SQL Server instance (like I do on all my instances), it might be useful to make this tool available for your colleagues. They can use it to determine the workload on the server, or to see if the query they are running is blocking other processes.

This was the exact question I got this morning. One of the members of our BI team wanted to have permissions on sp_WhoIsActive, and I was struggling (for the thousandth time) to remember the minimal permissions I needed to give him. So I’m going to be a smart guy for once, and document it here. And hopefully this might help you as well (and save you the time I lost on it).

 
Permissions on the object
To test this, I’ve created a new login (TestLogin) with just read permissions on a single database. If you try to execute sp_WhoIsActive with those permissions, you’ll see this error message:

Image

 
To fix that, go to the master database, add the login, and add execute permissions on the sp_WhoIsActive stored procedure:

Image

 
You could also script this out like this:

USE master
GO
GRANT EXECUTE ON dbo.sp_WhoIsActive TO TestLogin
GO

 
Now that that’s fixed, you still can’t execute sp_WhoIsActive:

Image

 
To fix that, you need to right-click on the instance name, go to properties -> Permissions, and add “View server state” permissions for the login:

Image

 
Again, you can also do this via T-SQL:

USE master
GO
GRANT VIEW SERVER STATE TO TestLogin
GO

 
If you execute sp_WhoIsActive now, it works without any issues.

Obfuscating your data with SQL Server 2016 Dynamic Data Masking

In today’s IT landscape, data security is a big deal. Just ask people like Troy Hunt (Blog | @troyhunt), who is a security expert, how losing data can destroy your company. Companies all over the world lose data every single day, and you might not even be aware of this. I’m still seeing companies who give all IT employees admin permission on the whole IT infrastructure: from webserver to database servers, and from customer relations system to financial system. But why is it still a struggle for IT professionals to protect their data? In some companies they don’t even hash passwords, let alone protect them with a certificate or even heavier protection.

In this blog I’m not going to tell you how to secure your data, because honestly I’m not an expert at that. I do want to introduce you to a new way to obfuscate your data, that was introduced in SQL Server 2016. According to Wikipedia obfuscation means: “(…)the obscuring of intended meaning in communication, making the message confusing, willfully ambiguous, or harder to understand”. Or in easy terms: make it harder to read for your users and/or employees. Let’s take a look at an example.

If I would give you an email address like “[email protected]”, it’s really easy to guess the name of the person. Let’s be honest, it’s not rocket science right?! But what if I would give you the email address “Jo*****@d*****.com”, would you still guess the name correctly? Yes I agree with you there’s a small chance you might guess the name right, but those chances are slim. And instead of writing your own code to obfuscate data this way, with SQL Server 2016 you’ll get it out of the box.

Creating resources
The following is tested on SQL Server CTP 2.1. If you’re not running that version or higher, this might mean the scripts or test cases might not work the same as in my case.

In order to test this new feature, let’s create a new database first:

USE master
GO

CREATE DATABASE DynamicDataMasking ON PRIMARY 
(NAME = N'DynamicDataMasking', FILENAME = N'C:\Database\DynamicDataMasking.mdf')
LOG ON
(NAME = N'DynamicDataMasking_log', FILENAME = N'C:\Database\DynamicDataMasking_log.ldf')
GO

 
Now let’s create a table called Users:

CREATE TABLE dbo.Users
	(UserID INT IDENTITY(1,1),
	 FirstName VARCHAR(100),
	 LastName VARCHAR(100),
	 Address VARCHAR(100),
	 DateOfBirth DATE,
	 SocialSecurityNumber VARCHAR(15),
	 Email VARCHAR(100))

 
This table contains some basic information about the users of our application. And of course we need some user data in the table. I’ve used Redgate’s SQL Data Generator to generate data for my table. Because I’ve generated a full table, I’ve made the script available here.

 
Now that we have a table with sensitive data, let’s look at the ways of obfuscating this data. From SQL Server 2016 onwards you get to use the Dynamic Data Masking feature. This means you can add a “mask” on top of your data. This is done by altering the columns in your table:

ALTER TABLE <TableName>
ALTER COLUMN <ColumnName> ADD MASKED WITH (FUNCTION = '<FunctionName>')

 
This takes care of the data obfuscation for you, and you can determine the level of obfuscation by using specific functions:

Default: Completely replaces the value in the column with “xxxx”
Email: Replaces the email address with X’s, except for the first character, and the Top-level domain
Custom: The most dynamic of the 3 functions. This allows you to configure a prefix and suffix, and replaces the rest of the values with X’s

 
Let’s add masks to the columns in our table:

ALTER TABLE dbo.Users ALTER COLUMN FirstName ADD MASKED WITH (FUNCTION = 'default()')
ALTER TABLE dbo.Users ALTER COLUMN LastName ADD MASKED WITH (FUNCTION = 'partial(1,"XXXXXXXXXX",1)')
ALTER TABLE dbo.Users ALTER COLUMN Address ADD MASKED WITH (FUNCTION = 'partial(10, "XXXXX", 0)')
ALTER TABLE dbo.Users ALTER COLUMN City ADD MASKED WITH (FUNCTION = 'partial(3, "XXXXX", 0)')
ALTER TABLE dbo.Users ALTER COLUMN State ADD MASKED WITH (FUNCTION = 'partial(4, "XXXXX", 0)')
--Country no masking
ALTER TABLE dbo.Users ALTER COLUMN DateOfBirth ADD MASKED WITH (FUNCTION = 'default()')
ALTER TABLE dbo.Users ALTER COLUMN SocialSecurityNumber ADD MASKED WITH (FUNCTION = 'partial(0,"XXX-XX-",4)')
ALTER TABLE dbo.Users ALTER COLUMN Email ADD MASKED WITH (FUNCTION = 'email()')

 
Testing data masking
Now that we have a table with masked data, how does that look from different perspectives? Let’s create 2 users: an application login with just read permissions, and an admin login with db_owner permissions:

USE master
GO

CREATE LOGIN [AppLogin]
	WITH PASSWORD = 'TestPass',
	--SID = 0xDB9ED49EF06F3A40B5024B36F5CDD658,
	DEFAULT_DATABASE = [master],
	CHECK_POLICY = OFF,
	CHECK_EXPIRATION = OFF
GO

CREATE LOGIN [AdminLogin]
	WITH PASSWORD = 'TestPass',
	--SID = 0xDB9ED49EF06F3A40B5024B36F5CDD658,
	DEFAULT_DATABASE = [master],
	CHECK_POLICY = OFF,
	CHECK_EXPIRATION = OFF
GO


USE DynamicDataMasking
GO

CREATE USER AppLogin FOR LOGIN AppLogin WITH DEFAULT_SCHEMA = dbo
GO

ALTER ROLE db_datareader ADD MEMBER AppLogin
GO

CREATE USER AdminLogin FOR LOGIN AdminLogin WITH DEFAULT_SCHEMA = dbo
GO

ALTER ROLE db_owner ADD MEMBER AdminLogin
GO

 
Now open up 2 new SSMS tabs, and log in with the 2 accounts. In both sessions run the query below:

USE DynamicDataMasking
GO

SELECT * FROM dbo.Users

 
The difference is clearly visible when you select the top 10 records in both sessions:

Image

 
In the admin connection you get to see the full dataset, and in the application login the masked dataset is returned.

 
Querying data
The retrieval and querying of data isn’t changed when you have data masks applied. If you run a query where you search for users with a specific first name, the correct results is returned:

SELECT *
FROM dbo.Users
WHERE FirstName = 'Jeffrey'

 
Security issues
Now we get to the interesting part: the security issues. Even though this is not a form of data encryption, I did expect this could be a part of data security. But unfortunately this was a false sense of security…

Let’s try a normal query on the masked data, with the AppLogin session:

USE DynamicDataMasking
GO

SELECT * FROM dbo.Users

 
This returns the data as expected: masked. But is there any way around this? Let’s make the AppLogin a db_owner on another database (run this statement with a user that has permissions to do this):

USE Sandbox
GO

CREATE USER AppLogin FOR LOGIN AppLogin WITH DEFAULT_SCHEMA = dbo
GO

ALTER ROLE db_owner ADD MEMBER AppLogin
GO

 
So the AppLogin is still db_datareader on the DynamicDataMasking database, and db_owner on the Sandbox database. Now let’s run the query below:

USE Sandbox
GO

SELECT *
FROM DynamicDataMasking.dbo.Users

 
Well, that’s awkward! If your application login has db_owner permissions on another database, you can query the data from the users table without the data masks!

But I know what you’re thinking. My application logins aren’t db_owner anywhere so I’m safe. WRONG! Let me show you another example:

USE DynamicDataMasking
GO

SELECT
	U1.*
FROM dbo.Users U1
INNER JOIN dbo.Users U2 ON U2.USerID = U1.UserID

 
Well hello precious data! If you just join a table to ANY other table (or join it to itself), all data is returned without masking.

This must be all right? There’s one last thing…

Let’s try to insert the masked data into a temp table, and select that result:

USE DynamicDataMasking
GO

SELECT *
INTO #UsersTemp
FROM dbo.Users

SELECT *
FROM #UsersTemp

DROP TABLE #UsersTemp

 
I’m not sure what the idea behind of this feature was, or how the SQL Server designed it, but this sounds like a real security issue to me. I expect my data to be obfuscated for my application users, but it’s the complete opposite. If you have a direct connection to the database (and not through an application only) it’s really easy to get a hold of the unmasked data.

 
Conclusion
Even though I really like this feature (and yes, I’m serious!) there are some things the SQL Server team needs to look at. If you’re expecting your data to be masked for all non-admin users, you’re in for a nasty surprise.

Hoping this will be fixed soon, I’ve created a Connect item for this. If you agree with me on this, and you think it’s a problem as well, please up-vote it or leave a comment in the connect item. There is also a specific item for the join issue. Let’s make sure the SQL Server team is aware of these issues.

Time traveling with SQL Server 2016: Temporal tables

Since the release of the first publicly available SQL Server 2016 CTP2, we have a whole list of new and cool features we can start using. One of those features is called temporal tables (or system-versioned tables). So what are temporal tables, and how can you use them?

 
What is a temporal table?
To understand the functionality of temporal tables, we first need to agree on the definition of a table in SQL Server. If you run a query on a table that contains data, that query can only return the current version of a record. This means you can only see the current “truth”, and there’s no way to travel back in time to see older versions of this record.

Temporal tables give you the opportunity to time travel in SQL Server. For every data change (Update, Delete and Merge) in your table, a historical copy is stored in a history table. The table on which you enabled this data tracking is changed to a “System-Versioned” table.

Image

 
How does it work?
For every update or delete on a table where system_versioning is enabled, a historical copy of the record is stored:

Image

The original image can be found in this blog post, written by Manoj Pandey (Blog | @manub22).

 
But how does that work? Let’s start by creating a table we will use to test system-versioned tables:

CREATE TABLE dbo.BankAccount
	(AccountNumber INT CONSTRAINT PK_BankAccount_TransactionID PRIMARY KEY,
	 AccountBalance FLOAT);

 
In order to make a table a system-versioned table, we need to add 2 datetime2 columns to our newly created table. SQL Server will use these columns to store a from- and to-date that will indicate the valid period of time of the record. By telling SQL Server to use these 2 columns with the keywords “PERIOD FOR SYSTEM_TIME”, SQL Server knows that it needs to use these columns when querying data from the history table:

ALTER TABLE dbo.BankAccount
ADD ValidFrom datetime2 GENERATED ALWAYS AS ROW START HIDDEN NOT NULL,
	ValidTo datetime2 GENERATED ALWAYS AS ROW END HIDDEN NOT NULL,
	PERIOD FOR SYSTEM_TIME (ValidFrom, ValidTo);

 
Image
In the above script, the “HIDDEN” keyword is used. This can only be used from CTP 2.1 and higher. What HIDDEN does, is hide the columns in your original table to make sure application- and database code isn’t going to fail because you added these 2 new columns. You can still query the columns, but if you run a “SELECT *” query these columns won’t be returned.

 
When that’s done we can enable system-versioning on the table:

ALTER TABLE dbo.BankAccount
SET (SYSTEM_VERSIONING = ON (HISTORY_TABLE = dbo.MyBankAccountHistory));

 
Data changes & history
Now we can take a look at how data changes are captured, and history is recorded. Before you execute any of the statements below, enable the execution plan in your SSMS. If we insert a new record, no history is created:

INSERT INTO dbo.BankAccount
	(AccountNumber, AccountBalance)
VALUES
	(2147483647, 10000)

 
We just see the expected Clustered Index Insert, nothing special:

Image

 
Now, let’s update the bank account balance (the WAITFOR is added just to make sure we have a clear difference in change time for the next few steps):

UPDATE dbo.BankAccount
SET AccountBalance = AccountBalance - 2500

WAITFOR DELAY '00:01:00'

UPDATE dbo.BankAccount
SET AccountBalance = AccountBalance + 1000

 
If you look at your execution plan, you’ll see an extra DML command in the execution plan:

Image

 
Besides the expected Clustered Index Update, there is an extra Clustered Index Insert. This is the insert statement that is generated by SQL Server, to insert a record in the history table. There’s no user interaction needed to store historical data. SQL Server will take care of that process for you.

 
Time travelling
Now that we store historical data, it’s time to start the actual time travelling. To paint a complete picture, this is a timeline of the data inserts and updates:

Image

 
Now that we have a clear timeline, let’s start our time travel. Besides creating and maintaining the history table, you also get to use a bit of new syntax in your query. For system-versioned tables, you can use the “FOR SYSTEM_TIME” clause in your query. In order to show you the timeline in SQL Server, let’s use this new syntax to query our history per minute:

SELECT * FROM dbo.BankAccount FOR SYSTEM_TIME AS OF '2015-07-09 09:42:00' --No data available
SELECT * FROM dbo.BankAccount FOR SYSTEM_TIME AS OF '2015-07-09 09:43:00' --First insert
SELECT * FROM dbo.BankAccount FOR SYSTEM_TIME AS OF '2015-07-09 09:44:00' --First update
SELECT * FROM dbo.BankAccount FOR SYSTEM_TIME AS OF '2015-07-09 09:45:00' --Second update
SELECT * FROM dbo.BankAccount FOR SYSTEM_TIME AS OF '2015-07-09 09:46:00' --No other changes

 
Remember, this is based on my data. So if you want to query your timeline, change the datetime string based on your data!

So basically, you can start querying your data by using a specific point in time:

DECLARE @PointInHistory DATETIME2
SET @PointInHistory = '2015-07-09 09:45:00'

SELECT * FROM dbo.BankAccount FOR SYSTEM_TIME AS OF @PointInHistory

 
Besides the actual point in time, you can use 3 other ways to query your data:

SELECT AccountNumber, AccountBalance, ValidFrom, ValidTo
FROM dbo.BankAccount
FOR SYSTEM_TIME FROM '2015-07-09 09:43:00' TO '2015-07-09 09:45:00'


SELECT AccountNumber, AccountBalance, ValidFrom, ValidTo
FROM dbo.BankAccount
FOR SYSTEM_TIME BETWEEN '2015-07-09 09:43:00' AND '2015-07-09 09:45:00'


SELECT AccountNumber, AccountBalance, ValidFrom, ValidTo
FROM dbo.BankAccount
FOR SYSTEM_TIME CONTAINED IN ('2015-07-09 09:43:00', '2015-07-09 09:45:00')

 
Table changes
In practice you’ll not only see data changes happening on tables, but you’ll also have schema changes on your table once in a while. But how does a temporal table cope with schema changes? Let’s try to add a column to our table:

ALTER TABLE dbo.BankAccount ADD NewColumn VARCHAR(10)

This results in an error:

Image

 
In order to add a column, we need to disable the system-versioning first, before we add the new column:

ALTER TABLE dbo.BankAccount SET (SYSTEM_VERSIONING = OFF)
GO

ALTER TABLE dbo.BankAccount ADD NewColumn VARCHAR(10)
GO

 
Now let’s enable system-versioning again:

ALTER TABLE dbo.BankAccount
SET (SYSTEM_VERSIONING = ON (HISTORY_TABLE = dbo.MyBankAccountHistory))
GO

 
This results in another error:

Image

 
So we first need to add the same column to the history table, before enabling system-versioning again:

ALTER TABLE dbo.MyBankAccountHistory
ADD NewColumn VARCHAR(10)
GO

ALTER TABLE dbo.BankAccount
SET (SYSTEM_VERSIONING = ON (HISTORY_TABLE = dbo.MyBankAccountHistory))
GO

 
Image
Disabling system-versioning means that for a short period of time, you could loose historical data. A possible way to get around this, is by setting your database in single user mode before you disable it. This prevents other user settings from changing data in that table. If you run this in your production environment, this might not be your best option though! By disabling system-versioning, historical data will not be removed.

 
Indexing historical data
Performance isn’t only important when you query your “normal” tables, but also if you want to query your newly created temporal tables. If you want to write a business process that uses your historical data, you need to make sure this doesn’t slow down your application. But how do you achieve that?

Just like on a normal table, you can create indexes no the history table. This table is basically a normal table, so there’s no reason why you can’t create indexes on it:

CREATE NONCLUSTERED INDEX IDX_MyHistoricalData
ON dbo.MyBankAccountHistory (AccountNumber, AccountBalance)

 
Historical data cleanup
It’s really great to store historical versions of your records in a separate table, but this also provides you with new challenges. You need more storage for your data, and you might want to remove data after a certain period of time. At this point in time, system-versioned tables don’t have a cleanup process. This might change in the future, but right now you need to cleanup these tables yourself. So if you want (or need) to cleanup old data, you need to write a small process yourself. This can be as easy as writing a query to run through all system-versioned tabled and delete old data, and schedule that in a SQL Server Agent job. But again, this is something to keep in mind when you start working with temporal tables.

I had a really good conversation about this with Borko Novakovic (@borko_novakovic), who is the Program Manager for this part of SQL Server. The code below is an example of such a process, that Borko provided:

BEGIN TRAN 

    /*Drop versioning to allow deletion of historical data*/
       ALTER TABLE dbo.BankAccount
              SET (SYSTEM_VERSIONING = OFF)
 
       /*DELETE MyBankAccountHistory table*/
       DELETE
       FROM dbo.MyBankAccountHistory
       WHERE ValidTo < '2015.01.01'
       
       /*Re-establish versioning*/
       ALTER TABLE dbo.BankAccount
              SET (SYSTEM_VERSIONING = ON
                  (HISTORY_TABLE  = dbo.MyBankAccountHistory,
                   DATA_CONSISTENCY_CHECK = OFF));

COMMIT

 
Deleting data without disabling system-versioning doesn’t work, because you’ll get an error like this:

Image

 
I do want to thank Borko again for his time. He helped me out a lot, and I’m thankful he took the time to do that. Thanks Borko!!!

 
Remove system-versioning
Removing system-versioned tables from your systems takes one extra step, because just executing a “DROP TABLE” statement doesn’t work. SQL Server will prevent you from dropping temporal tables, without you first disabling it. Let’s start by disabling system-versioning:

ALTER TABLE dbo.BankAccount SET (SYSTEM_VERSIONING = OFF)
GO

 
This disables the system-versioning on your original table, and transforms the history table to a normal table. If you want to get rid of the tables, you can just drop them both like you would normally do:

DROP TABLE dbo.BankAccount
GO
DROP TABLE dbo.MyBankAccountHistory
GO

 
Resources
Besides this blog, there are 2 fantastic posts you need to read about this topic, written by Itzik Ben-Gan (Blog | @ItzikBenGan), that you can read at SQLMag.com (Part 1, Part 2).

One thing you definitely MUST SEE is a video with Borko and Scott Klein (Blog | @SQLScott) on Channel 9. In this video, Borko explains the idea behind temporal tables, and shares some insights on this new feature.

Other information on temporal tables can be found on MSDN:

Temporal Tables
sys.tables
SQL Server 2016 (MSDN root)

Source control: Using Visual Studio Online in SSMS

As database professionals, we’re all aware of the importance of backups. We make sure the backup process runs as expected, and (hopefully) we restore a backup every now and then to test if the restore process works. But what about source control for your scripts? Most of us don’t use source control in our daily job. But source control is a much a part of the backup process as the actual database backups.

So looking for an easy way out, I focused on Visual Studio Online (VS Online). This is a free online source control system, that you can use once you created an account. You can login on the website with your Microsoft Live account, enter some information (like a username, etc), and you’re ready to go!

But how do you go from writing a query in SQL Server Management Studio (SSMS), to checking in your .sql code files into VS Online? Let’s take a look.

 
Installing TFS tools
In order to use VS Online, you need to install some extra things on your machine. The first thing you need to download is the “Team Explorer for Microsoft Visual Studio 2013”. This installs the team explorer, that you need to get things from and check thing into VS online. This install requires a reboot, so please take that into account!

The second and last installation is the “Microsoft Visual Studio Team Foundation Server 2013 MSSCCI Provider”. This installs the provider, that takes care of the communication with VS Online.

For this installation, it’s important that you download the right version. If you’re running the 32-bit version of SSMS, you need to download the 32-bit version of the provider. If you install the 64-bit version, it won’t work (and trust me on this, I’ve made that mistake before!).

 
VS Online
At this point, I’m assuming you have an account for VS Online. If you log in to the website, and you go to your account url ([AccountName].visualstudio.com), you see the “Create your first team project” page. On this page, you need to create a project before you can check in any files:

Image

 
Configure source control in SSMS
The next step is to configure SSMS, to use the source control provider you just installed. After the installation, you get a new menu in SSMS for source control:

Image

In this menu, click on “Open from Source Control”. In the window that opens, click “Servers…”:

Image

Click “Add…” to add a TFS server or URL:

Image

Now you need to enter your account URL in the textbox:

Image

Once you’ve done that a login screen pops up. Log in with your Microsoft Live account (the same you used to create your VS Online profile), and you’re authenticated:

Image

At this point, your source control is added, and you’ll see it in the overview screen:

Image

If you close the windows that are shown, you end up in your source control project overview:

Image

 
Creating a SQL Server Scripts project/solution
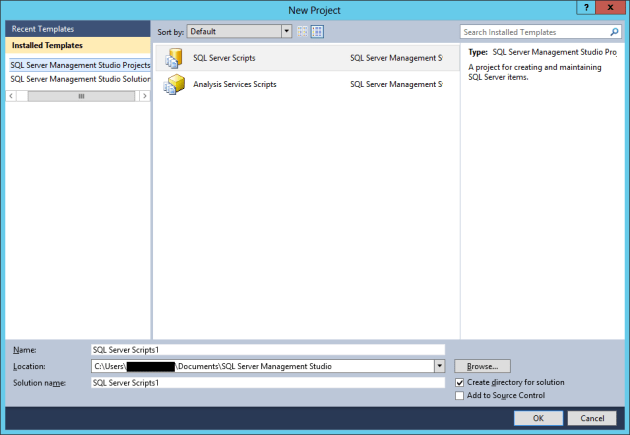
Now that we’ve installed the source control providers, it’s time to create our SQL Scripts project. In SSMS, click on File => New => Project (or Ctrl+Shift+N), and choose “SQL Server Scripts”:

Image

Now that you have a project, it might be handy to show what’s in the solution (if you don’t have that on your screen already). You can open the “Solution Explorer” by clicking on View => Solution Explorer (or Ctrl+Alt+L).

 
Checking in your solution
If you want to check-in your solution or project, you can right-click it in the Solution Explorer, and choose “Add Solution to Source Control”:

Image

 
Another way of doing it, is by clicking on File => Source Control => Add Solution to Source Control. In the next window you are asked for the source control server (click okay if your VS Online URL is selected), and you see the project explorer:

Image

Click on “MySQLProject”, and click OK. Now the check-in screen pops up, where you can “tag” your check-in:

Image

Congratulation! You just checked in your first code in VS Online!

 
Pitfalls and difficulties
In all honesty, there are some downsides in using this, but those are mainly issues in SSMS. For example, you can’t create folders in your SQL Script project. You have to work with the default “Queries” folder you get by default. So there’s no chance you can add a “Finance”, “Maintenance” or “DBA” folder to your project for example.

A work-around for this is creating multiple projects in the solution. So you’ll end up with 3 projects in 1 solution. The nice thing is that you can check-in or check-out 1 single project in your solution, or you can just work on the entire solution at once. This gives you the possibility to work on the solution on your own, or with a group of people.

Another pitfall is the process. If you’re not used to working with queries in source control, it’s easy to forget to check-in your changes at the end of the day. But that’s just something you need to get used to, and need to deal with in your own way. If you’d like to check-in multiple times a day, go ahead and do that. Do you want to check-in your changes at the end of the day only, it’s fine as well.

 
Conclusion
Using source control is great, especially when you have a lot of scripts you need to maintain. I’ve tried to create zip-archives, version numbering my .sql files, different directories, etc. But there’s always a moment that you forget to save your script in an archive, or your computer crashes, and all your work is gone. Using source control prevents these issues (if you use it as intended of course!). VS Online is a really good source control platform (it’s basically TFS online), and it’s free for use. One of the mayor advantages is that VS Online / TFS is fully compatible with SSMS and Visual Studio (which you both use as database professional).

Are you still skeptical? Maybe you should just try it out for a week, to see if it helps you in your daily job. And you know what, maybe you’ll like it. And even better: maybe it’ll someday save your life!

On which port is SQL Server running?

Earlier this week, a good friend asked me the simple question: “How can I check on which port my SQL Server is currently running?” There are multiple ways, so let’s take a look at the ways you can find out the answer!

 
SQL Server Error Log
It’s a misconception that only error messages are logged in the SQL Server error log. There are also informational messages logged, which you can use to find the port on which SQL Server is currently running:

xp_readerrorlog 0, 1, N'Server is listening on'

 
The result:

Image

 
SQL Server Configuration Manager
The SQL Server configuation manager is a tool which is installed alongside SQL Server. In this tool, you can change for example the TCP/IP settings of your SQL Server. It also shows you the current port on which SQL Server is running:

Image

 
DMV
You can also query the system DMV’s:

SELECT DISTINCT 
    local_tcp_port
FROM sys.dm_exec_connections
WHERE local_tcp_port IS NOT NULL

or

SELECT local_tcp_port
FROM   sys.dm_exec_connections
WHERE  session_id = @@SPID

 
Command prompt
Finding the used port via a command prompt requires some more information. First, you need to find the process ID (PID) that SQL Server is using. The quickest way is to use the Task Manager in Windows. Once you have the PID, you can run the commmand below:

“netstat -ano | findstr [PID]”

The result:

Image

 
Registry
The port number can also be found in the registry. Just remember, that the folder you see in the screenshot below contains my instance name (SQL2014DEV). Change this to your instance name!

Image

 
You can also use the “master.dbo.xp_regread” stored procedures to read this registry key from T-SQL:

DECLARE @TCPPort NVARCHAR(5),
        @RegKeyName VARCHAR(8000);

SET @RegKeyName = CONCAT('Software\Microsoft\Microsoft SQL Server\',
                         @@SERVICENAME,
                         '\MSSQLServer\SuperSocketNetLib\TCP')

EXEC xp_regread
  @rootkey = 'HKEY_LOCAL_MACHINE',
  @key = @RegKeyName,
  @value_name = 'TcpPort',
  @value = @TCPPort OUTPUT;

SELECT @TCPPort;

 
Event Viewer
SQL Server also logs the port in the Windows Event Viewer. If you open the application log, and you filter on eventid 26022, you’ll see the port that is in use:

Image

 
PowerShell
After I posted this blog, Johan Bijnens (@alzdba) sent me a message: I forgot the PowerShell option!

#tcpport.ps1
#Evaluates the SQL Server instances on a Windows server and returns the TCP port number used by each instance
[System.Reflection.Assembly]::LoadWithPartialName("Microsoft.SqlServer.SMO")  | Out-Null
$m = New-Object ('Microsoft.SqlServer.Management.Smo.WMI.ManagedComputer') 'HOME'
$m.ServerInstances | ForEach-Object { $m.Name + '\' + $_.Name + ', ' +
       $m.ServerInstances[$_.Name].ServerProtocols['Tcp'].IPAddresses['IP1'].IPAddress.IPAddressToString + ':' +
       $m.ServerInstances[$_.Name].ServerProtocols['Tcp'].IPAddresses['IPAll'].IPAddressProperties['TcpDynamicPorts'].Value
       }

 
Thanks Johan for reminding me on this! The full code can be found on MSDN.

Speeding up your backups

Last week, I watched the SQLRally session of Pieter Vanhove (Blog | @Pieter_Vanhove), where he talked about Advanced Backup and Restore. He mentioned striped backups (taking a backup of a database, divided over a number of files). After watching the video, I started to wonder what made the biggest difference: the number of files, the number of disks, compression.

 
Test setup
In order to test this, I restored a copy of the AdventureWorks2012 database, that you can download from msftdbprodsamples.codeplex.com. But because this database is only 200MB, taking a backup would only take a second. In order to make this a bit more interesting, I used a script Adam Machanic (Blog | @AdamMachanic) wrote. This script creates 2 new objects in the AdventureWorks database (dbo.bigProduct and dbo.bigTransactionHistory), which results in a database of 2.8GB. You can download the script here.

 
What matters most?
In order to test the differences in performance, I’ve tested multiple combinations:

– Multiple files on single disk
– Multiple files on 2 disks
– Both options above, with and without backup compressions

After running all the different tests, I’ve added the results to an Excel sheet:

Image

 
The results you see are in milliseconds. The analysis on these numbers is a bit difficult, so let’s put these numbers in a graph:

 
Image

 
As you can see, the number of files (when looking at a minimum of 2 files) isn’t the biggest difference. The number of disks, and compression vs no compression make the biggest difference. In my case, I tested it on 2 SSD’s, but you may have more disks in your server. Or better yet, you are able to take backups on multiple LUN’s on your storage, and the LUN’s use multiple disks. The more spindles you can use, the faster your backup will become.

But there’s also a downside to this. When you want to restore a backup, you need all the files to do that. So when you restore a normal backup, you only need 1 file. If you’re going to stripe your backup over 16 files for example, you need all 16 files to perform a restore. So basically, the chance of having a corrupt backup file is 16x as high, compared to a normal (single file) backup. For every advantage, there’s always a disadvantage…

If you want to read more about backups, don’t forget to check out these blog posts:

Julie Koesmarno: On sabbatical
Mickey Stuewe: Transaction Log Backups for the Accidental DBA
Chris Yates: Backups – They Are Needed, Who Knew?

Find SQL Server Agent job history retention with T-SQL

In SQL Server, the Job Agent has its own retention that you can set. This retention determines how much execution history of SQL Server Agent jobs is being kept. But if you have a lot of instances across your domain, or if you reinstall a new server, how do you determine if this value is set correctly?

 
Doing it old-school: via the GUI
You can check the SQL Server agent retention via the GUI, by right-clicking on the SQL Server Agent, and clicking on properties. In the window that popped-up, click on History, and you’ll see something like this:

Image

 
T-SQL / Registry
The way I wanted to check it is with T-SQL. Because I want to run the statement against a 40+ instances, I use a multi-server query for that. The reason I do that, is that this returns all the results in a single table, which makes reviewing and comparing the results a lot easier.

But there doesn’t seem to be a way to query the set values. But with a little bit of searching, I found out that you use the stored procedure below to change one of the values:

EXEC msdb.dbo.sp_set_sqlagent_properties @jobhistory_max_rows = 999

 
So by dissecting this procedure, I found out SQL Server just reads the value from a registry key. I took out the piece that I need to read the retention values:

DECLARE @jobhistory_max_rows INT = NULL,
        @jobhistory_max_rows_per_job INT = NULL


EXECUTE master.dbo.xp_instance_regread N'HKEY_LOCAL_MACHINE',
                                        N'SOFTWARE\Microsoft\MSSQLServer\SQLServerAgent',
                                        N'JobHistoryMaxRows',
                                        @jobhistory_max_rows OUTPUT,
                                        N'no_output'
SELECT @jobhistory_max_rows = ISNULL(@jobhistory_max_rows, -1)


EXECUTE master.dbo.xp_instance_regread N'HKEY_LOCAL_MACHINE',
                                        N'SOFTWARE\Microsoft\MSSQLServer\SQLServerAgent',
                                        N'JobHistoryMaxRowsPerJob',
                                        @jobhistory_max_rows_per_job OUTPUT,
                                        N'no_output'


SELECT @jobhistory_max_rows, @jobhistory_max_rows_per_job

 
But when I wanted to look up the values in the registry, to see if it returned the correct results, I couldn’t find the actual keys. I thought I was losing my mind, but there’s a catch…

 
xp_instance_regread vs xp_regread
There are 2 stored procedures you can use to read registry keys from your SQL Server:

DECLARE @jobhistory_max_rows INT = NULL

EXECUTE master.dbo.xp_instance_regread N'HKEY_LOCAL_MACHINE',
                                        N'SOFTWARE\Microsoft\MSSQLServer\SQLServerAgent',
                                        N'JobHistoryMaxRows',
                                        @jobhistory_max_rows OUTPUT,
                                        N'no_output'

SELECT @jobhistory_max_rows

 
or

DECLARE @jobhistory_max_rows INT = NULL

EXECUTE master.dbo.xp_regread N'HKEY_LOCAL_MACHINE',
                                        N'SOFTWARE\Microsoft\MSSQLServer\SQLServerAgent',
                                        N'JobHistoryMaxRows',
                                        @jobhistory_max_rows OUTPUT,
                                        N'no_output'

SELECT @jobhistory_max_rows

 
The difference between the two is perfectly explained in this Stack Overflow thread:

xp_regread reads the literal registry path that you specify. xp_instance_regread “converts” the path you specify so that it matches the instance of SQL Server that you’re currently using.

 
So if you run multiple instances on your machine, you want to use the instance version of the stored procedure. If you’re just running 1 (default) instance, you can use both versions.

So eventually, I searched for the instance folder, and I did find the registry keys:

Image

 
Conclusion
Especially for very large environments, it’s a good idea to write system- and/or server-checks in T-SQL. That way, you can script them in SCOM (or another monitoring tool), or if you use SQL Server Policy Based Management (and I would really like to recommend this Pluralsight course from a very good friend of mine: Boris Hristov (Blog | @BorisHristov)!), or just a multi-server query.

Design a site like this with WordPress.com
Get started