-
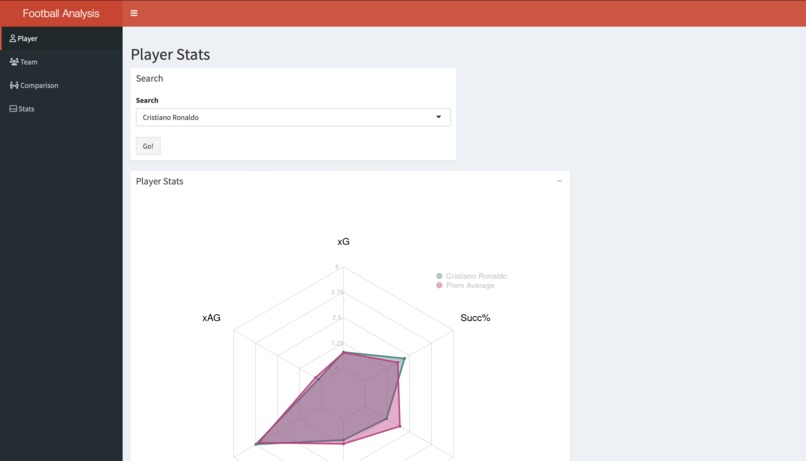
Player stats checking
-
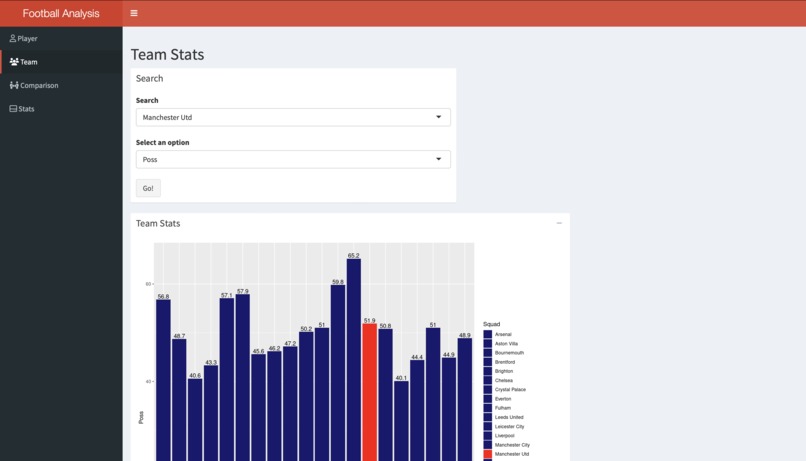
Team stats comparison
-
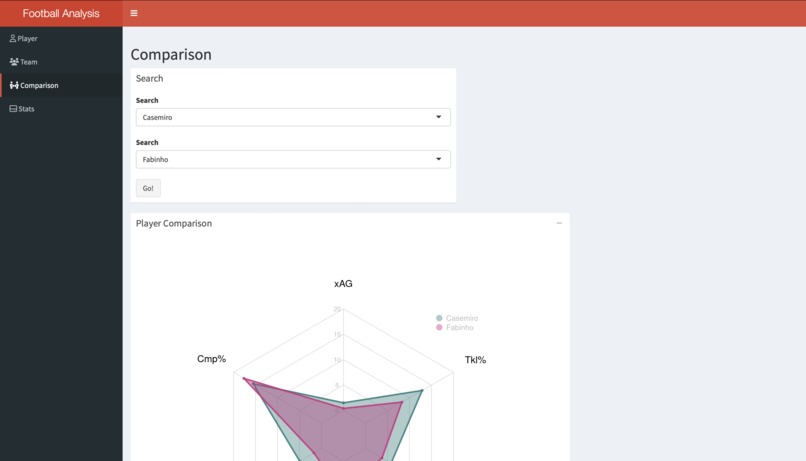
Player comparison


Inspiration
Ever since a young age, I was passionate about soccer and ever since then, I have been watching and playing a lot of it. In the past few years, I had asked myself a question: how would teams precisely know what impact the players have on the development of the game? How would they take decisions on which players are necessary to win, and which players are not as necessary? To the naked eye, this does seem complicated, but I wanted to make it simpler for users to see these stats, and to be able to search for any player/team they want to see how they compare to the rest of the league/world.
What it does
This website allows any user to input a name of their favorite player, as well as the name of their favorite team and see some graphs with statistical analysis of every team/player. This also allows teams and the organizations behind them to take more accurate decisions.
How I built it
I imported a database from a website, with all the stats being up to date, and cleaned it as well as presented it in a dashboard. All of this was done on RStudio, where I used the shinyDashboard library, along with some HTML and CSS in order to make the dashboard more approachable and easy to read for most users.
Challenges I ran into
7 Hours into the Hackathon, my original idea completely failed and my files had corrupted, after long tries to restore these files, nothing was working. I decided to change my idea completely, and change the approach and came up with this, because it linked both of my favorite things: data and soccer.
What I learned
I learned about HTML presentation as well as new libraries within RStudio. I also learned about how to deploy these projects on the web!
What's next for 12th Man
For now, only one league has been implemented, but more leagues and players will be added in the near future. I will also implement a user sign in page, as well as a home page to the project.


Log in or sign up for Devpost to join the conversation.