-
-
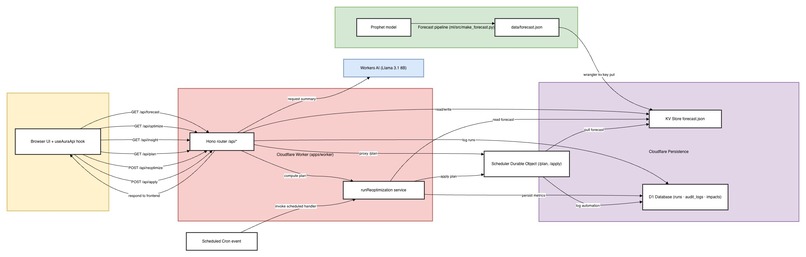
Work Flow
-
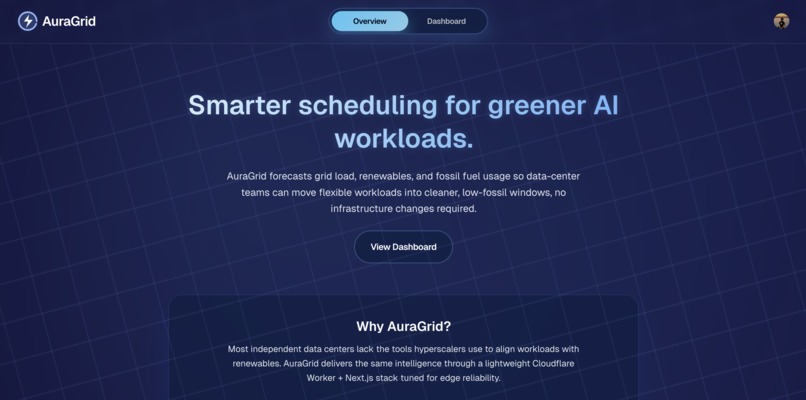
Homepage
-
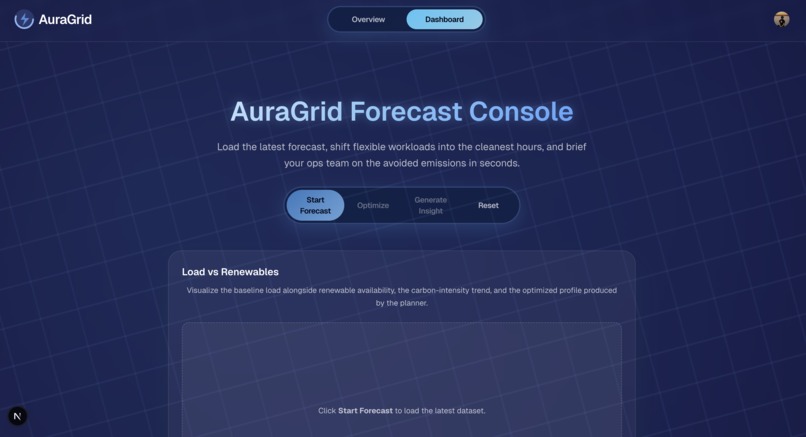
Dashboard 1.0
-
Dashboard 1.1
-
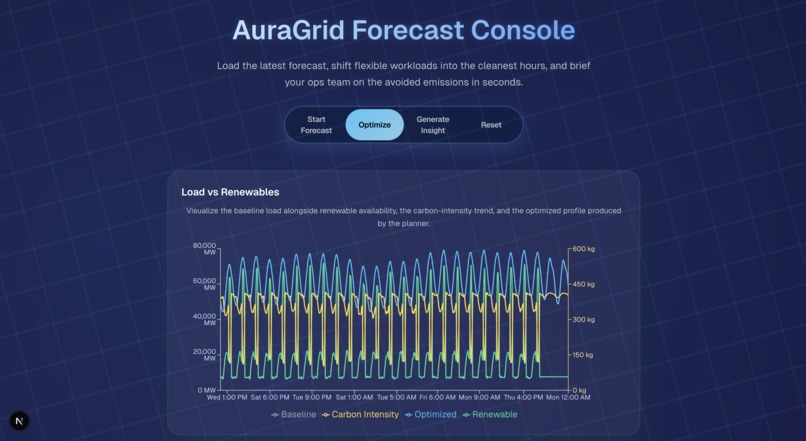
Dashboard 1.2


🌍 Inspiration
AI power demand keeps climbing but most GPU operators don’t have the carbon-aware tooling hyperscalers like Google and Meta rely on. Rolling out new infrastructure or running custom optimizers isn’t realistic for smaller cloud companies or research labs.
AuraGrid gives them a Carbon-First co-pilot that forecasts demand, guards peak load and shows how to shift flexible jobs into cleaner, off-peak windows without re-architecting their stack.
⚡ What It Does
AuraGrid blends short-term forecasting, edge optimization and human-readable insights into a single console:
Forecast – Prophet generates a 48 h hourly demand curve plus embedded carbon-intensity signals.
Visualize – The dashboard overlays baseline load, optimized load, renewables, and carbon intensity in one dual-axis chart.
Optimize – A cloud-friendly heuristic (shift budgets, peak guardrails, intensity thresholds) reallocates discretionary MW into greener hours while keeping peaks in check.
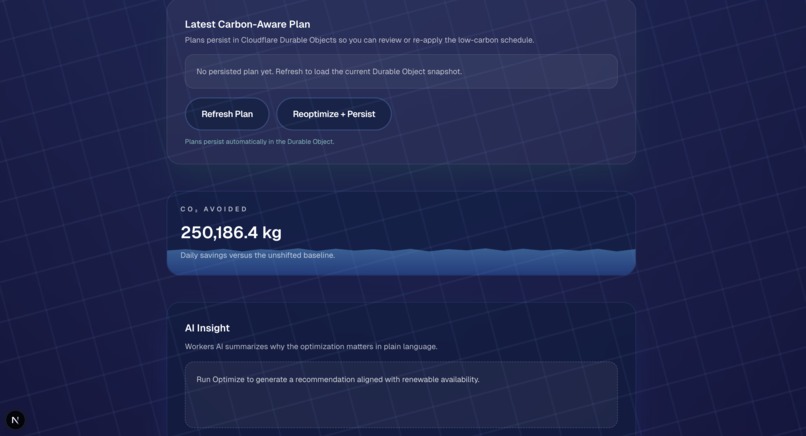
Data Persistance – Plans are versioned and stored in a Cloudflare Durable Object; users can refresh or reoptimize on demand.
Insights – Cloudflare Workers AI (Llama 3.1 8B) summarizes impact in plain language, with deterministic fallbacks when the model isn’t available.
🏗️ How We Built It
Frontend – Next.js App Router, Tailwind, shadcn/ui, and Recharts for a responsive “forecast → optimize → insight” workflow.
Backend – Cloudflare Workers (Hono + TypeScript) expose /api/forecast, /api/optimize, /api/plan, /api/reoptimize, and /api/insight, all running at the edge.
Durable Objects + D1 – Persist plans, audit writes, and support future multi-tenant versions with cron-driven reoptimization.
Storage – Cloudflare KV holds compact forecast JSON for instant global reads.
AI Insights – Workers AI calls Llama 3.1 8B on demand, with a metrics-based fallback summary so the UX never stalls.
ML Pipeline – Python Prophet fuses ERCOT load and open renewable data, computes carbon intensity, and writes forecast.json ready for KV.
🧩 Challenges We Ran Into
Forecast data – Cleaning six months of ERCOT + renewables data, resampling to hourly UTC, and validating every row to ensure consistent carbon-intensity values.
Guardrail tuning – Finding defaults that respected peak limits while still producing visible shifts required several iterations (intensity deltas, shift budgets, guardrail ratios).
Renewable–load correlation – We discovered at midnight that high system load and high renewable generation often occur simultaneously. Suggesting users to move compute to nighttime—when fossil-fuel reliance peaks and renewables dip—was counterproductive. We reworked the optimization logic to include dynamic guardrails: when the grid is strained, high-compute low-urgency tasks are deferred, and when renewable output is abundant and demand is moderate, those tasks are scheduled.
🏅 Accomplishments We’re Proud Of
Delivered an end-to-end carbon-aware scheduling flow — forecast, optimize, persist, explain — all running serverlessly on Cloudflare.
Simplified the KPI surface to emphasize hard-proof emissions savings, avoiding misleading zero-percent visuals in strict guardrail scenarios.
🧠 What We Learned
Working on AuraGrid taught us that carbon-aware scheduling goes far beyond algorithms and interfaces; it’s a lesson in understanding both data and energy systems. Early on, we discovered that Texas’s grid is powered by roughly 34% renewable energy but only about 6% of that is solar, which means clean power availability often peaks during the same hours when demand is already high. This forced us to confront the complexity of balancing efficiency with sustainability. We learned that shifting compute tasks isn’t as simple as “run at night”, in fact, that can increase fossil fuel use when renewables drop and grid strain rises. Our solution evolved to include adaptive guardrails that respect grid conditions, prioritizing low-urgency, high-compute tasks when renewable output is abundant and demand is moderate. Beyond the technical side, this experience deepened our appreciation for how difficult it is to keep data centers both performant and sustainable. It also reinforced how critical data hygiene, reliable edge fallbacks and transparency in tradeoffs are when building real-world systems that interact with the physical energy grid.
🚀 What’s Next for AuraGrid
User-aware tenancy – Replace the demo tenant with Clerk user IDs so each operator sees their own plan history and insights.
Historical analytics – Surface trendlines from D1 logs (saved CO₂ over time, peak compliance streaks, plan versions).
Adaptive guardrails – Let teams tune shift budgets and guardrail ratios per site, plus add regression tests so heuristic tweaks remain safe.
External integrations – Webhooks or API endpoints that push optimized schedules back into orchestration systems (Kubernetes, Slurm, Terraform).
Live data feeds – Swap static ERCOT CSVs for live carbon-intensity APIs to keep the forecast fresh without manual uploads.
Built With
- cloudflare
- hono
- nextjs
- prophet
- python
- recharts
- tailwind


Log in or sign up for Devpost to join the conversation.