-
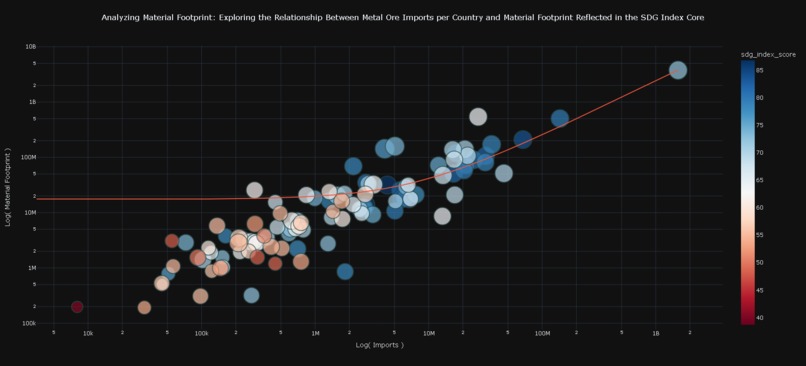
Analyzing Material footprint: Exploring the relationship between Metal Ore Imports and per Country and Material footprint Reflected in SDG
-
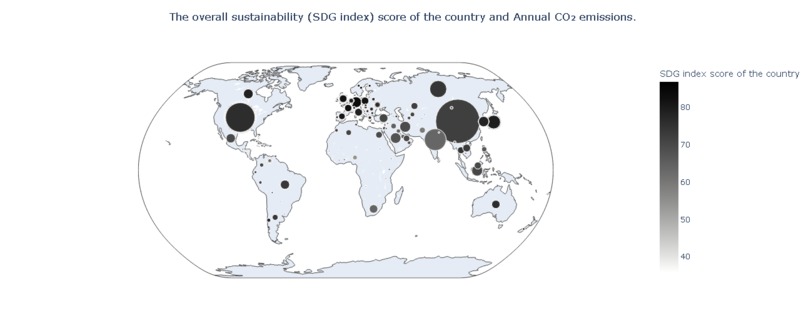
The overall sustainability (SDG index ) score of the country and Annual CO emissions
-
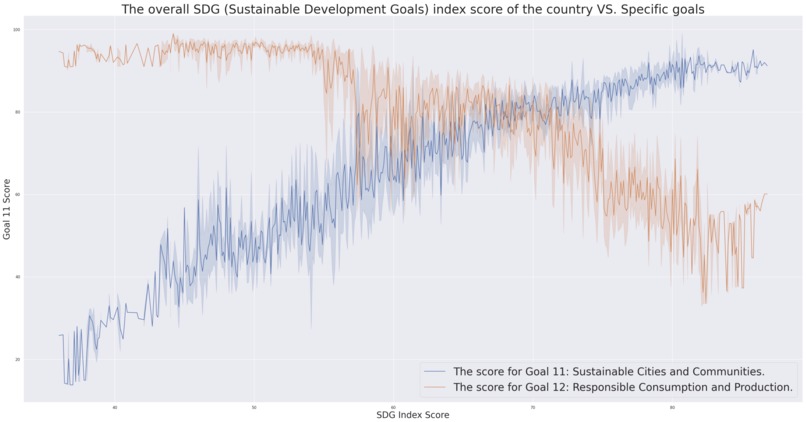
The overall SDG (Sustainable Development Goals) index score of the country Vs. Specific goals
-
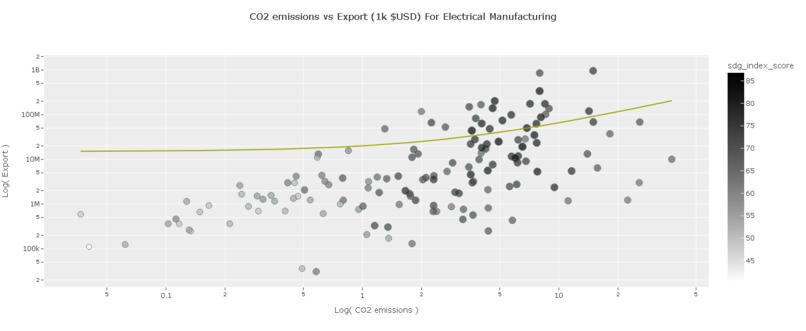
CO2 emissions vs Export (1K $ USD) For Electrical Manufacturing
-
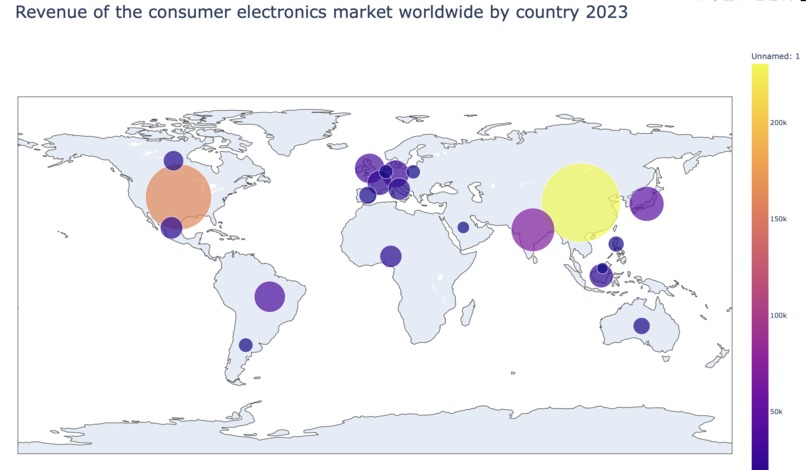
Revenue of the consumer electronics market worldwide by country 2023


Inspiration
When examining the general data regarding the 17 goals of the UN, we compared Goal 11 (concerning sustainable cities and communities) with other UN goals. Shockingly goal 12 seemed to be the only one that would decrease when goal 11 was increasing. This observation suggested that sustainable cities would ironically exhibit non-responsible practices of consumption and production. We then sought explanations beyond this simple correlation; what is our definition of sustainability? who is responsible for environmental impacts? which regions benefit from sustainable cities and which benefit from responsible production?
What it does
The project raises awareness of countries that impact other nations negatively with their extraction of resources and production of goods but are still deemed sustainable. In other words, it unveils the hidden negative impacts of sustainabilities cities, or on a larger scale, sustainable countries, to other regions of the world. Specific examples such as CO2 emissions, trade and overall sustainability score were all used to present our storyline.
How we built it
First, we looked at the correlation between the difference goals of the UN. We then looked for some databases involving global CO2 emissions, trade(material footprint) and SDG index. We divided our teams into two, one concerned with the production of graph and the other one concern with the analyzing of the data and making of the storyline. With the help of the python interpreter, the matplotlib librairies from pyplot and seaborn we produced line plot a map scatter plot. We then analyze these graph to produce a storyline that would connect all of these observations.
Challenges we ran into
We faced many challenges, but most notable, communication. For instance, task were distributed evenly among the team, yet, since the instructions given were often unclear, we would quickly find ourselves going off path. We resolved this problem by taking a longer session to discussed about our individual tasks where would we made sure that each team members would clearly understand what was best to do. Moreover, finding the desired data was very challenging as we would have difficulty finding data sites that was concerned with aspects that we deemed essential to our storyline. Finally, the scaling of the x-axis of most of the graphs were challenging to produce in a readable manner. Indeed, it would often consists of all the 195 countries. With that much values on the x-axis our graphs would often look crammed and hard to understand.
Accomplishments that we're proud of
We are definitely proud of the observation we made based on the first graph, which inspired the general storyline. Furthermore, we are immensely proud of the coders of our team whose expertise was essential to the production of the high-quality graphs. Our complex storyline would never have been supported without their knowledge.
What we learned
Although ambition is necessary to any projects, we have learned that sometimes simplicity is key for the creation of such extensive projects. We have also learned the clear communication is essential to keep everyone on track and be efficient, especially with a short time-frame.
What's next for The irony of sustainable cities
The goal of our story was to expose. The logical and most impactful sequence to this would be to make accountable the countries currently being praised for their initiatives and being perpetrators of ‘greenwashing’. The criterion for qualifying as sustainable would have to take into account the environmental impact of global economic relations and subsequent damages inflicted abroad for ç nations would be responsible.


Log in or sign up for Devpost to join the conversation.