-
-
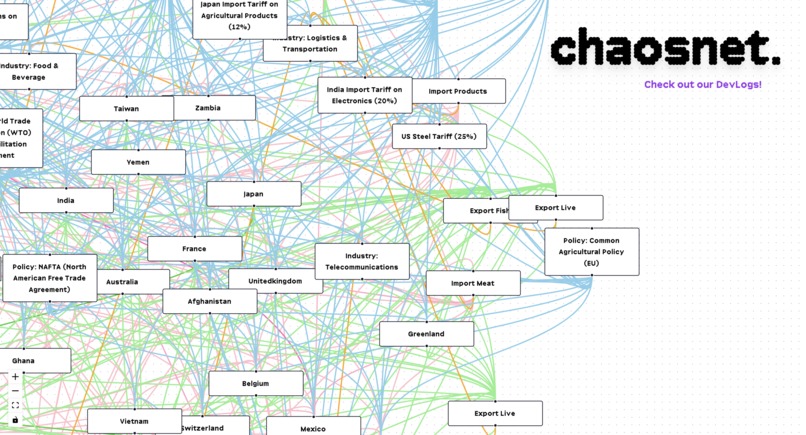
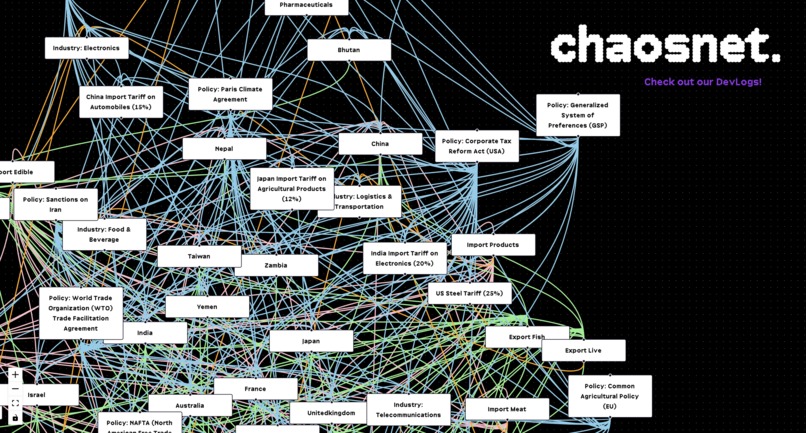
Initial Knowledge Graph
-
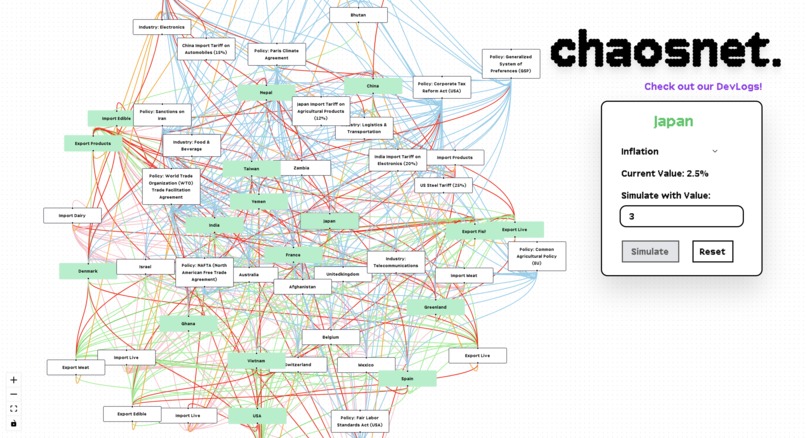
Simulation
-
-
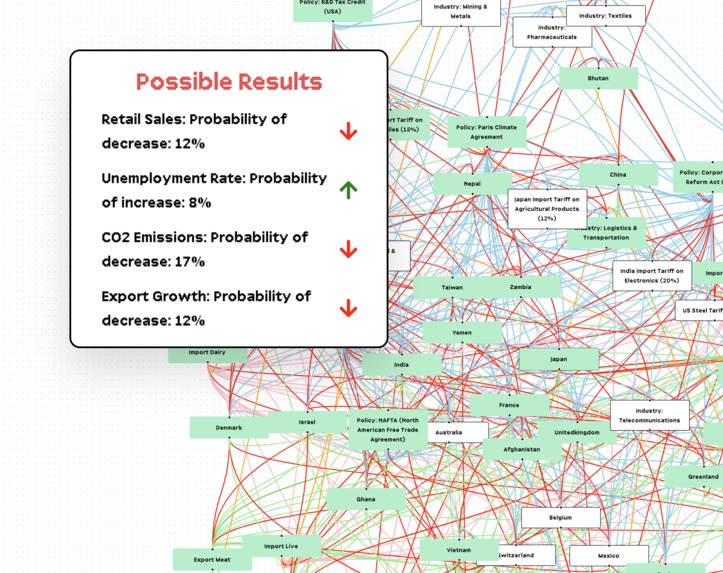
Results


Inspiration
We love simulations. A few weeks ago, we decided to simulate options pricing using some complex math, and after we did that, we thought... why dont we try to simulate global trade, across the entire world? The goal of this project is to see as we change trade policies between two or more countries (Nodes in our network), how it globally affects the entire world, as well as those countries economies. The things we found that shocked us were as we change small % of inputs (i.e., an import tariff increase on agricultural goods in chile by .1%) can lead to affecting countries who are not even a part of the trade. We are shocked, and impressed.
What it does
We developed a real-time visualization that showcases the simulations. We calculated the Partial Equilibrium, which allowed us to model and find the probability that as we change input parameters, we can find the ripple affect across various countries. Things like changing one trade policy can affect how a country inflates its currency, finds new trade partners and more. Our visualization shows all the relations in real time. Our application uses Knowledge Graphs to store Countries, Industries, and Relationships between them as nodes. We then run our simulator, iterating over all neighboring nodes and find probabilities of economical change as we alter the inputs. We passed 99 industries to our model, and end up restricting it to only 6 because there is so much data uncovered.
How we built it
We used a wide-range of technology, we did a lot of the data processing in python, with pandas and numpy. We wrote the math formulas out in Matlab to take advantage of vector and matrix operations. We found this speed increase to be crucial for our projects run time. We spun up a front-end with React, Next.Js and produced real-time chart visualizations in D3.js. The charts are dynamic and interactive, so please play with them. Finally, we deployed our application to vercel and gave it the hostname: https://chaosnet.world/.
Challenges we ran into
There were many challenges. We thought simulating this would be easy, but as we dug into the math, we realized there are so many paths our simulation can take. For example, when a country imposes a tariff on another, the responding country has the option to trade elsewhere, inflate their currency against the others in some way, or impose retaliation tariffs. This is just a few examples, and modeling these three was a challenge in such a short time! Our charts are dynamic, and we found that as we simulate our relationships, there are so many outputs and possible paths. Limiting our data was a challenge, because we wanted to show it all, but we cannot due to resource constraint, and the size of our network growing large.
Accomplishments that we're proud of
We are super happy to say that we completed the project, hosted it, and provided real-time visualizations of all the simulations. The end result is a knowledge graph that shows the relationship network of all connected nodes, and shows the probability of how the countries respond to their inputs changing. This can be the probability that the country decreases their workforce for a specific industry by a certain %, or the probability that the stock market surrounding this specific product increases by X %. The possibilities are endless, and we are super happy we were able to showcase the probabilities in relation to world trade simulations.
What we learned
We learned a lot about world trade, and we learned a lot about performing real-time simulations and producing visualizations to showcase it. We had a lot of fun figuring out all the different paths a simulation can take, and the math behind it. We learned a lot about matlab, and D3.js.
What's next for ChaosNet
We want to continue simulating more scenarios. Trade policies are endless, and things like politics, global events, economical market events can drive simulation outputs to change. We would like to simulate as many scenarios as we can and keep having fun developing it.


Log in or sign up for Devpost to join the conversation.