-
-
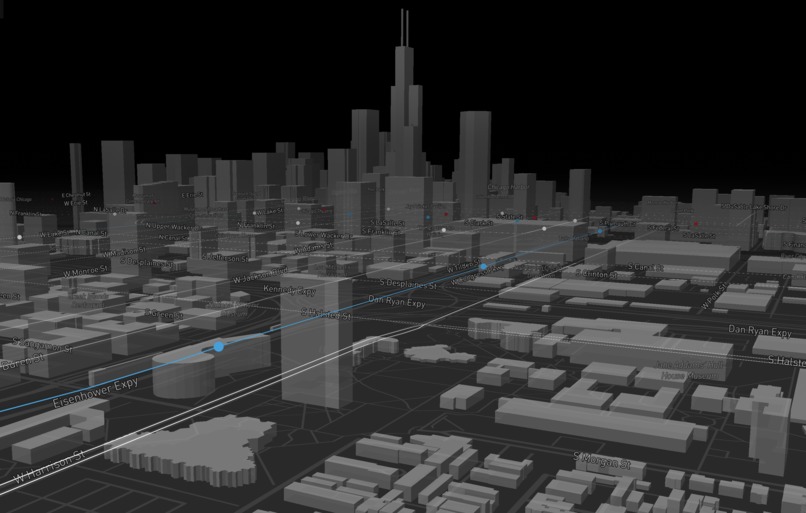
A nice view of Chicago and Blue line
-
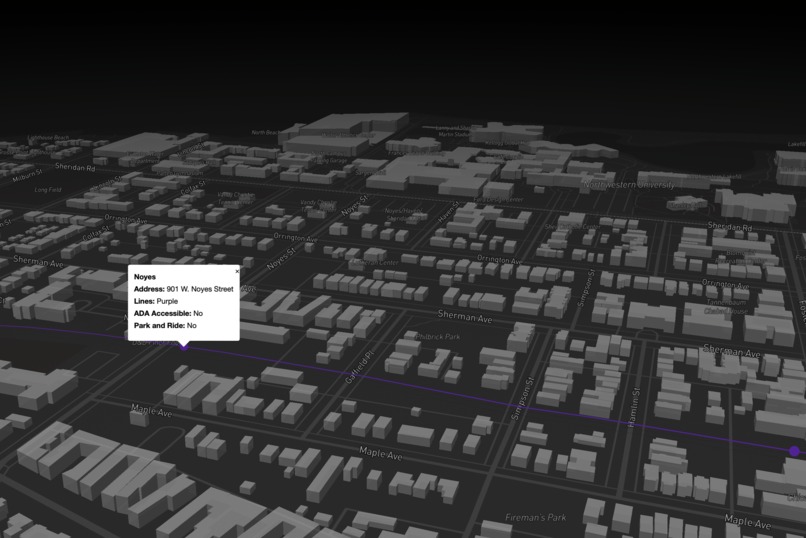
Is this Northwestern? And Noyes station?
-
Why they are so close to each other?
-
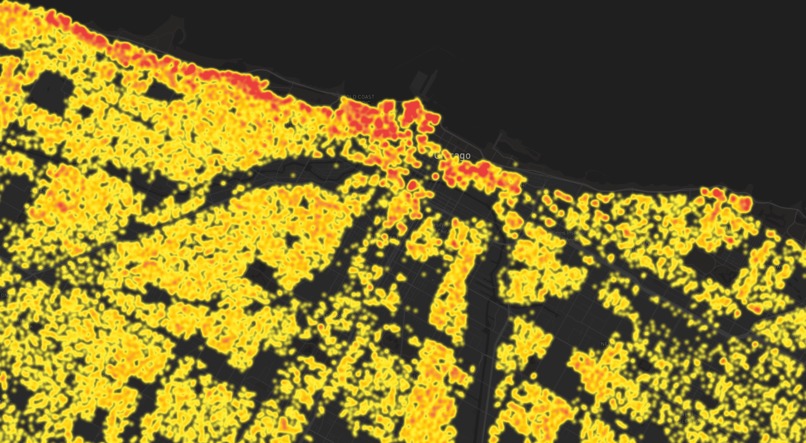
Looks like people like to live at shore
-
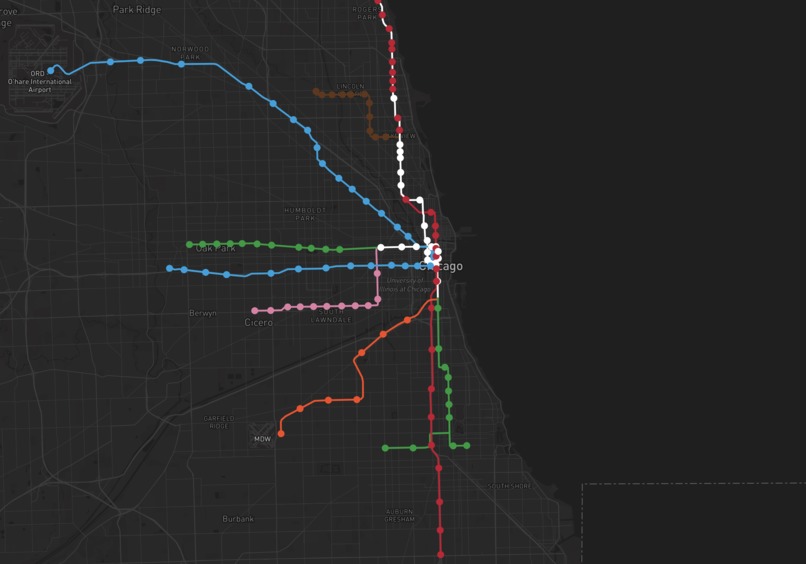
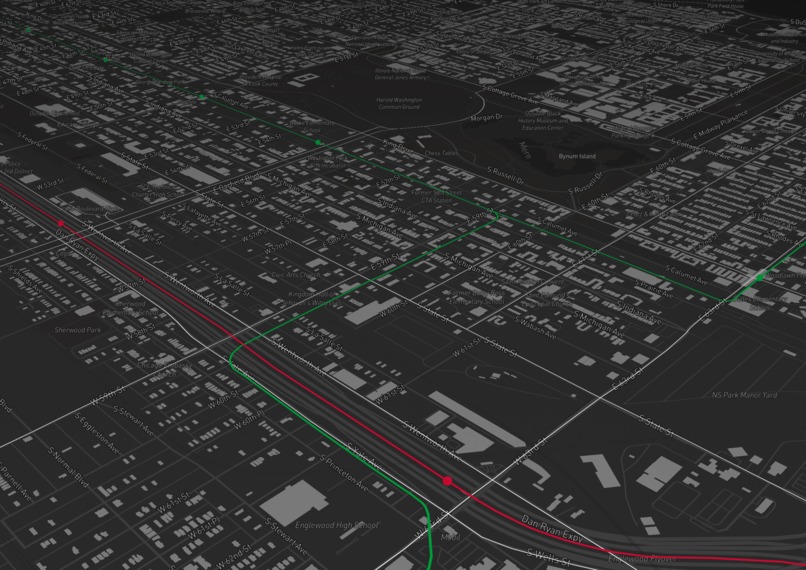
L
-
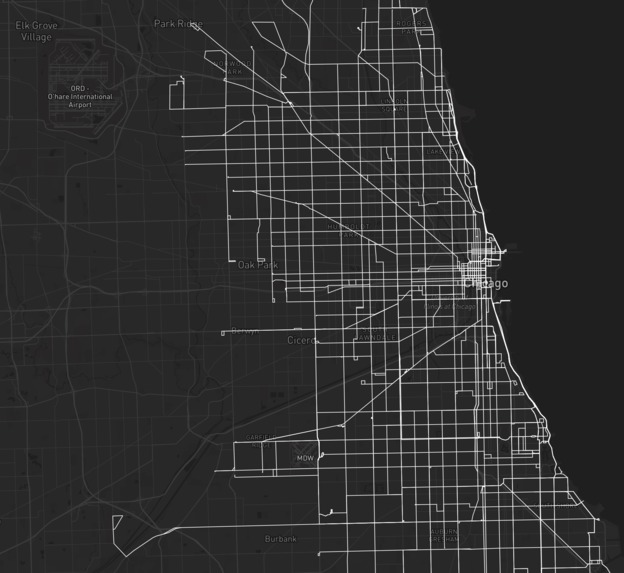
Why there are so many rectangles...bus routes...?


Inspiration
We an unreasonable love of trains, and city-wide data. We also are avid riders of the CTA,
What it does
Displays transit data, as well as relevant data about the city that would be useful to someone moving around or learning more about specific areas of the city.
How we built it
We created a website using react and JavaScript. The map was created using mapbox. Transit data was provided by the CTA.
Challenges we ran into
Accurately getting the L lines to line up, setting up the map, and launching on AWS.
Accomplishments that we're proud of
We are proud that it looks aesthetically pleasing, and that it accurately displays data that is useful to users.
What we learned
How to use maps and display data with maps.
What's next for Chicago Atlas
Filtering specific L stops so they only display ADA approved stops, as well as adding real-time data on train and bus times. We also want to add more data such as on walkability, income, and more.

Log in or sign up for Devpost to join the conversation.