-
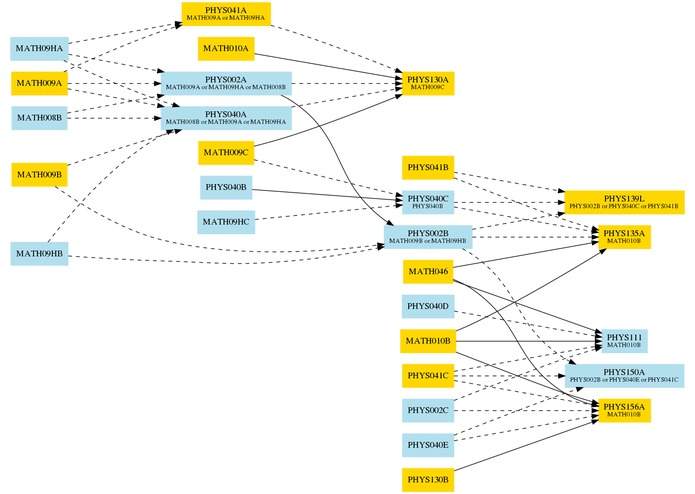
Course map for Physics

Inspiration
The course catalog does not clarify clearly the prerequisites for any upper-division courses. Here's our pitch for new members.
What it does
Generates a graph from a given list of courses and prerequisites, with a couple settings:
- A chosen major to draw the prerequisite list for
- Provide a list of major required courses to get colored nodes
- Removes grad level courses (at request)
How we built it
We used python3, graphviz, and the json library. We started with a data set from William Shiao. See ~/data and ~/docs/data. The data set contained the names of courses with prerequisites.
Challenges we ran into
The 'and' and 'or' statements were imported incorrectly in Shiao's dataset. We had to modify the import method to get the raw strings from it instead, and created a parser to interpret which courses were in the 'and' and 'or' groups. The data set contained some courses without prerequisites which threw a KeyError. We could not get a PDF to a text converter to work in python3. We chose a pdf to text converter because we wanted to extract the information from the course catalog of some given year. Each year, UCR posts their catalog at catalog.ucr.edu. Moving the nodes around so the graph looks more readable. Dot wasn't optimized for our precise use case, so it did require some fiddling.
Accomplishments that we're proud of
Writing an parser to correctly import the 'and' and 'or' statements. The coloration of the courses that are required by major. The creation of the graph such as the dotted lines, and shapes. Setting up hyperparameters for the code.
What we learned
Learning to use python3 and graphviz. Learning to import json files into python3 files.
What's next for Class Flow
Removing non-major courses from a major graph to decrease graph complexity. Expand the number of quarters for the data that we have which is in collaboration with William Shiao. When finished, bring to the UCR advisors to integrate into their system. Potentially sell it.

Log in or sign up for Devpost to join the conversation.