-
-
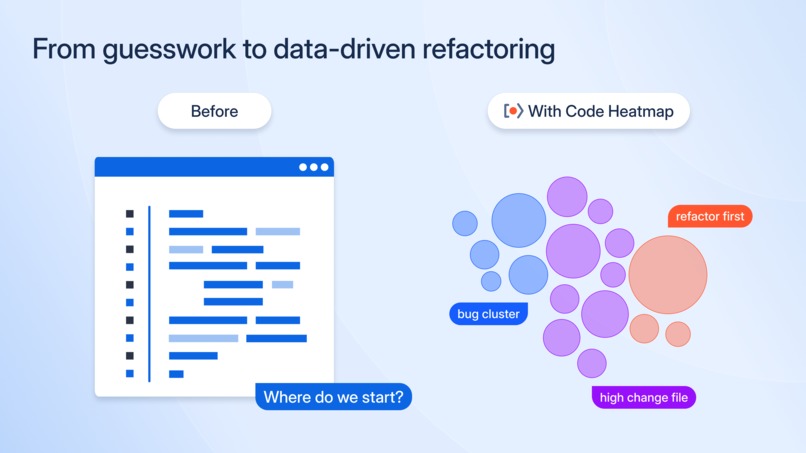
From guesswork to data-driven refactoring
-
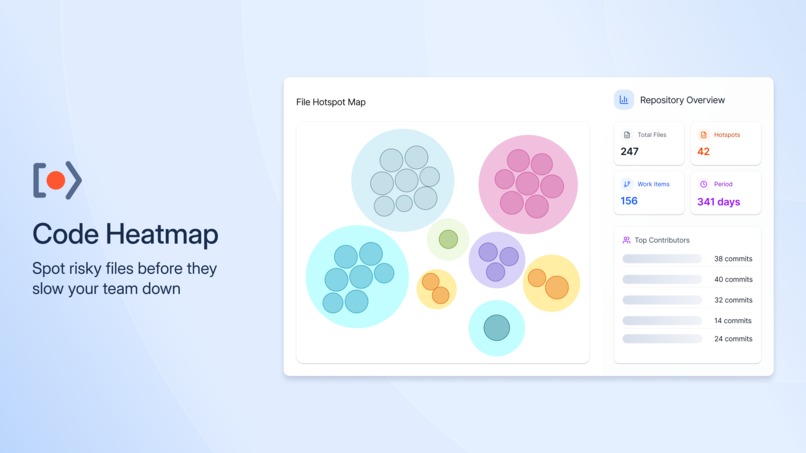
Spot risky files before they slow your team down
-
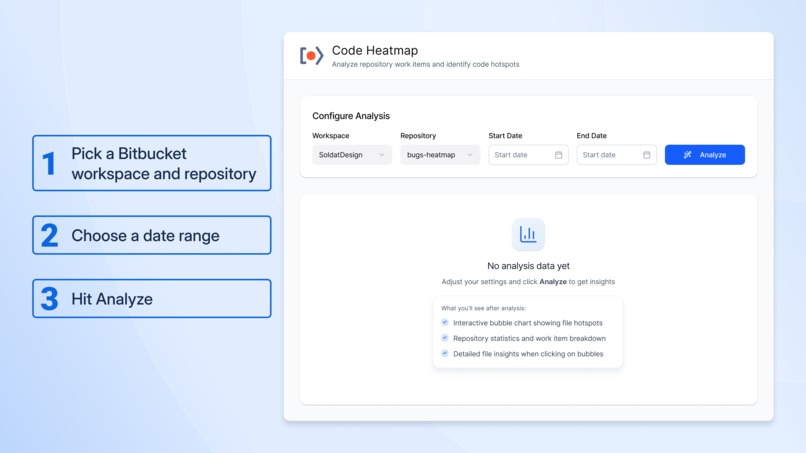
Create a Code Heatmap in two clicks
-
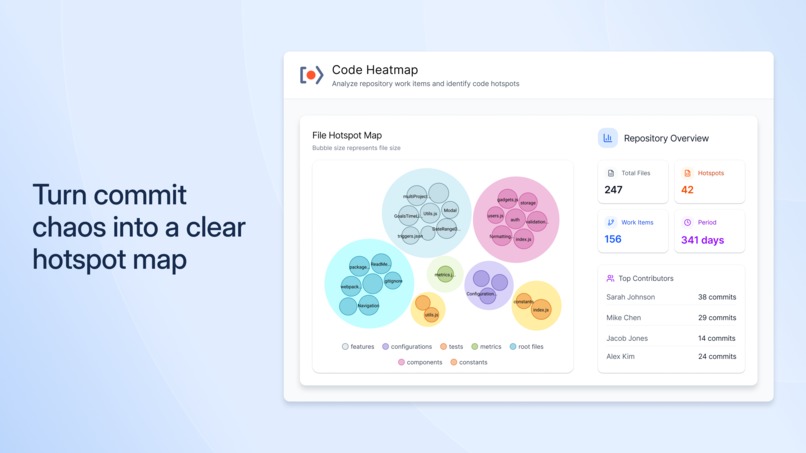
Turn commit chaos into a clear hotspot map
-
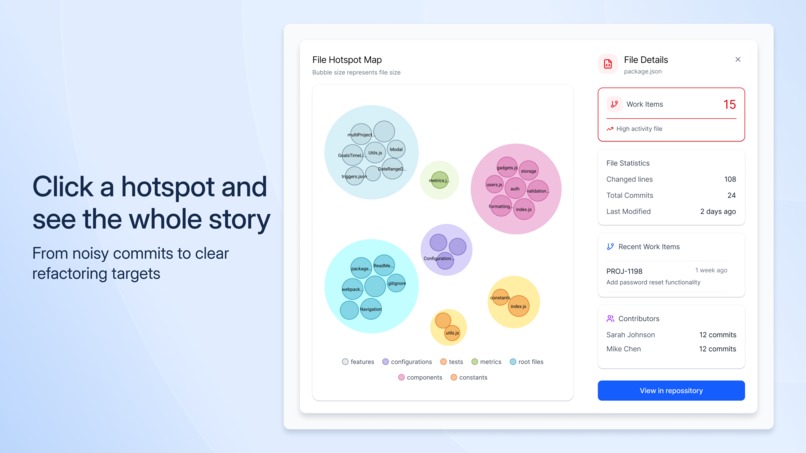
From noisy commits to clear refactoring targets
-
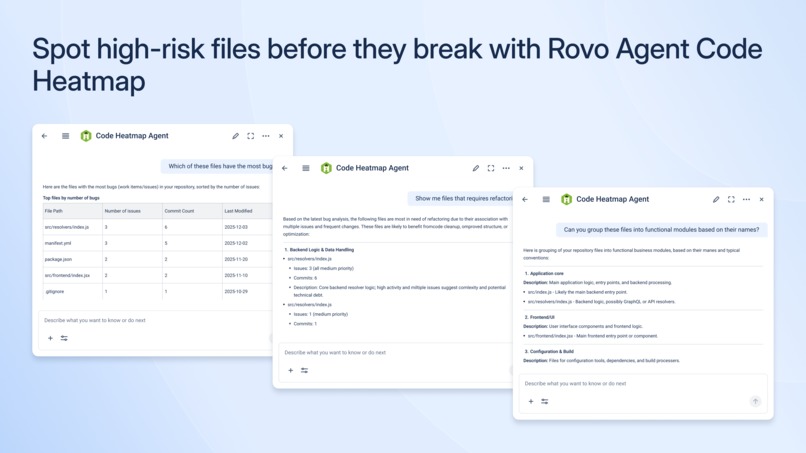
Spot high-risk files before they break with Rovo Agent Code Heatmap


Inspiration
Engineering leaders keep running into the same blind spots:
- Where is our codebase most fragile?
- Which files keep collecting bugs?
- Where should we refactor first to actually reduce risk?
Traditional repo stats only show raw git churn and line counts. They don’t explain where issues land or which parts of the codebase slow the team down.
Code Heatmap was created to give teams a data-driven way to prioritize technical debt, so they can stop guessing and focus improvements where they’ll have the biggest impact.
It helps teams prioritize technical debt with data, not gut feeling, and supports sprint planning or refactoring “pit-stops” by clearly showing where changes and issues are concentrated.
What it does
With one click, Code Heatmap analyzes a Bitbucket repository and builds a File Hotspot Map that connects:
- Completed work items (issues, bugs, tasks)
- Actual code changes (files and commits)
Here’s how it visualizes risk:
- Bubble size shows the file’s size/footprint.
- Color intensity shows how many work items touched that file.
Files are grouped into logical clusters (components, utils, hooks, config, etc.), making hotspots easy to scan. On the right, a Repository Overview summarizes:
Total files
Hotspot count
Work items (for the selected period)
Time period analyzed
Top contributors
This gives tech leads and managers a quick health snapshot of the repository.
What problems it solves:
- Identifies files that repeatedly cause bugs or risky changes.
- Highlights prime candidates for refactoring, instead of guessing.
- Reveals clusters of related files where many issues land, signaling deeper architectural problems.
By focusing on issues linked directly to commits, Code Heatmap helps teams work like F1 pit crews:
they know exactly which part of the car to touch first to gain speed and reliability.
How we built it
We started with a prototype on Atlassian Forge, using Rovo Dev to generate the basic project structure, UI, and integration modules.
Then we iteratively connected the Bitbucket API, tested different approaches to data retrieval, and gradually shaped the architecture around it.
In the end, this turned into a purpose-built Bitbucket-centric architecture that transforms raw repository activity into a clear, visual hotspot map developers can actually use.
Challenges we ran into
The biggest challenge was understanding what data we could really get from the Atlassian ecosystem. On paper, Jira and GraphQL looked like the perfect sources, but in practice they didn’t return the commit–to–task details we needed.
We expected to pull a clean list of tasks with their linked commits, but quickly realized that Jira and GraphQL simply weren’t exposing the right information. That forced us to rethink the plan, lean more on Bitbucket data, and experiment with different endpoints and mappings until we could reliably connect work items to actual code changes.
Accomplishments we're proud of
We’ve built a tool that finally makes codebase “hot spots” visible instead of just guessed.
Code Heatmap clearly shows which files attract the most activity and issues, so teams can actually see where their time is going — and decide, with confidence, where to refactor, stabilize, or double-check first.
It turns what used to be a vague feeling of “this area is messy” into concrete, visual evidence the whole team can align around.
What we learned
We learned the hard way that, in integration projects, it’s critical to validate data availability early on instead of assuming “the API will definitely have that.”
What helped us a lot was:
- Rapid prototyping – building small, end-to-end slices just to see what data we actually get back.
- Being willing to throw away unsuccessful approaches instead of forcing them to work.
This mindset saved us a lot of time and frustration. In short, test the reality of the data first, design around it second.
What's next for Code Heatmap
We don’t just want to show where the code is “hot” today — we want to show why it’s changing and how it affects quality, speed, and risk. Next up on our roadmap:
AI Code Visibility
We plan to add repository- and commit-level AI detection, so teams can see where AI-assisted code is likely introduced and by whom. This should help teams keep track of AI usage instead of guessing.Impact Analytics
We want to connect AI-related code patterns with real outcomes: sprint metrics, bug rates, and technical debt. The goal is to help engineering leaders understand the actual impact of AI on their codebase — not just how often it’s used.Security & Quality Signals
We’re planning to integrate static analysis and security scan results to highlight vulnerabilities and risky patterns, especially in AI-influenced code. That way, Code Heatmap doesn’t just show where the code is busy, but also where it might be fragile or unsafe.
Built With
- atlaskit
- bitbucket-api
- copilot
- forge
- forge-storage
- highcharts
- javascript
- jira-api
- react
- rovo
- stack
- vsccode


Log in or sign up for Devpost to join the conversation.