-
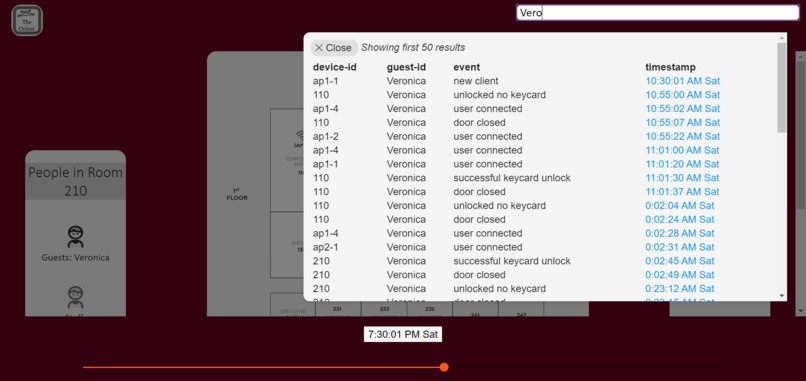
Bulk search
-
Using the interface


Inspiration
The forensic team approached us to create a tool that displays the Richcraft Hall Hotel data that clearly measures, analyzes and correlates the association of the events and activities in the last 24-hour period before the victim's body was discovered. We couldn't let them down.
What it does
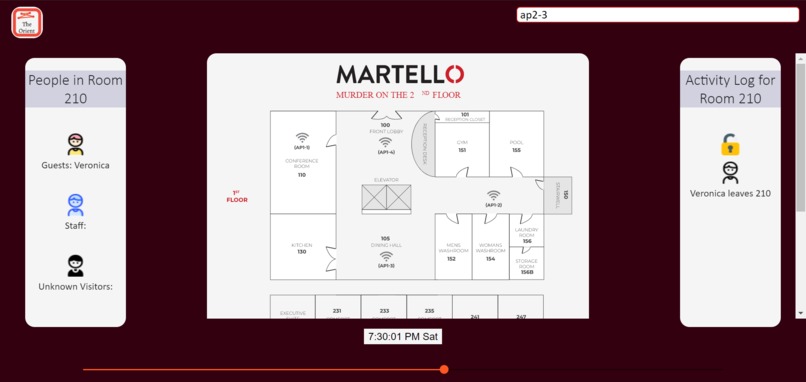
Our application displays an interactive map of the hotel along with all details of what happened in the 24 hours before the murder happened. Police can access any time in the 24 hours and see rooms people were in, Wi-Fi access points people were connected to, activations of motion sensors, opening/unlocking of doors with or without key cards.
Built with
Programming Languages used: JavaScript, HTML, CSS, Angular.js Database: MongoDB, mongoose Node.js
Challenges we ran into
SVG interactive map: the map wasn't the best and the second floor has no proper rectangles to click on so we had to insert manually, and learning how to use it.
Updating the MongoDB database: in order to parse the data that was given to us we created a set of functions to extract data from the JSON file and push it to MongoDB in the cloud. Initially, we wanted to use transactions to make sure every single table was correctly uploaded without failure and at the end of the operation we would not experience any loss of data. Unfortunately, the mongoose NPM module had bugs with its transactions API so we were unable to implement this.
What I learned
SVG baby! Synchronizing the timelines of each sensor and querying each event in the cloud without needing to scrub the data initially.
What did we learn
Angular JavaScript, SVG, algorithm time complexities particularly when parsing data, Mongo dB
What's next for cuHacking the Orient
Developing a scalable new algorithm that efficient parses any given dataset regardless of size and makes it queryable in the cloud
BTW We signed up for the MArtello challenge

Log in or sign up for Devpost to join the conversation.