-
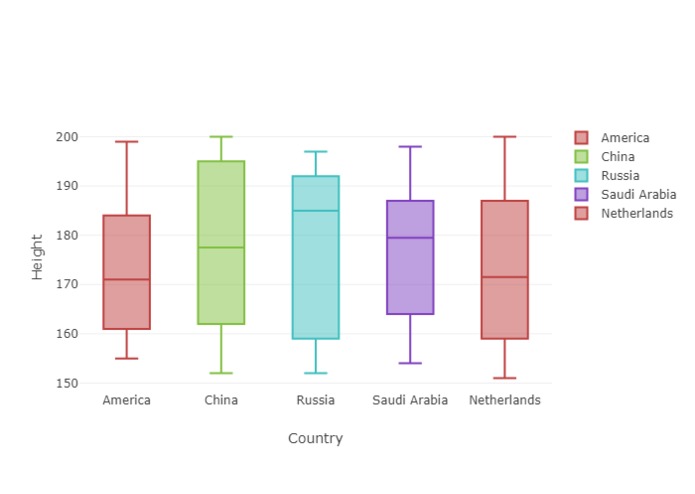
Proof of concept of a boxplot fucntionality, not implemented due to time contsraints

dh2018
Durhacc 2018 repository
Curious Correlations
The hack we set out to do was to present medical statistics in a more presentable, user-friendly way. We did this first by scraping the FHIR database for interesting fields. Next, we used Plotly to visualise said data by plotting a scatter plot of a user-given variable x against a user-given variable y. The graph was supported by a linear trendline, derived using least-square-fit methodology, as presented in "Measurements and Uncertainities" by Ifan Hughes and Thomas Hase, page 74. It is presented as an interactive html file which can be interacted with by hovering over a specific data point to see the specific coordinates.
The website uses a python program to link the html and css to the graph html.
Built With
- domain.com
- fhir
- html
- javascript
- json
- python
- tpp

Log in or sign up for Devpost to join the conversation.