-
-
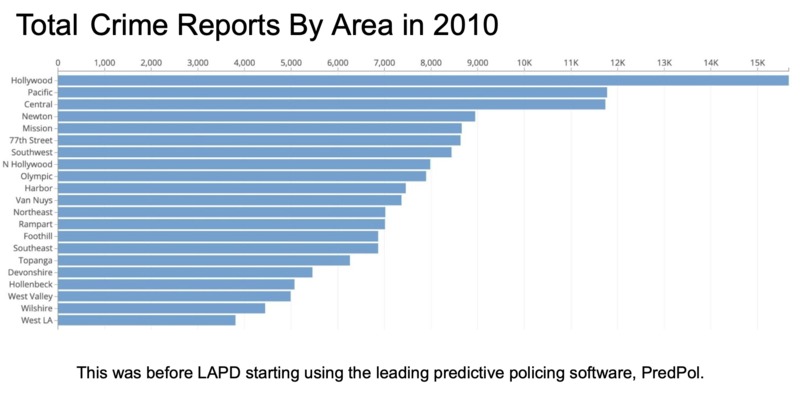
Total crime in 2010
-
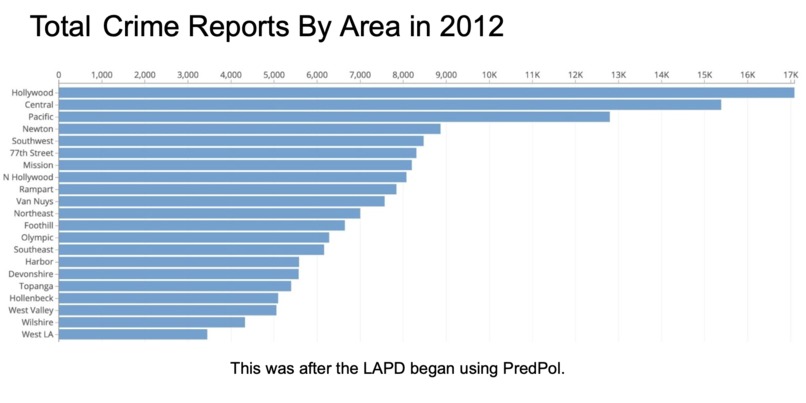
Total crime in 2012
-
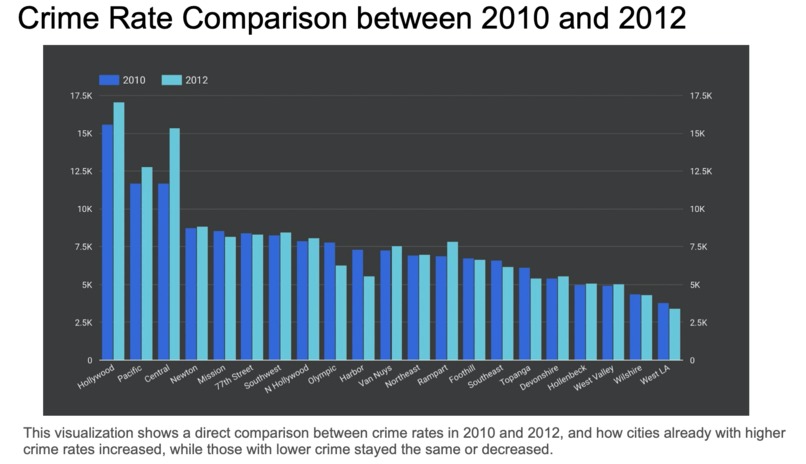
Crime rate comparison between 2010 and 2012
-
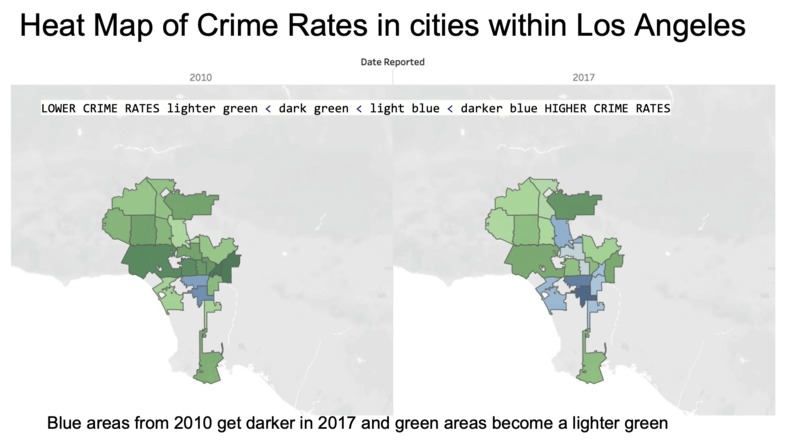
Heatmap of crime rate


Inspiration
While growth in technology has been exponential in the past decade, algorithms and mathematics using big data have been weaponized. Software programs such as PredPol, LASER, KeyStats, and more use predictive policing as a resource to increase policing productivity. However, these algorithms use old crime data to predict new crime, causing feedback loops that target the same communities of people of color or those of lower socioeconomic status over and over again.
As people try to numerify human behavior, there are undoubtedly many biases that are neglected and harm large groups of people. Using LAPD's publicly available crime data, we wanted to show how these programs affect already disenfranchised neighbourhoods.
While LAPD stopped using PredPol in light of the rise of Black Lives Matter movements in 2020, other police departments like NYPD still largely rely on this software. Through our code and data analysis, we built an interactive dashboard of different visualizations showcasing the effects of PredPol on Los Angeles crime rates.
What it does
In hopes of studying the effects predictive policing software, namely PredPol, have on crime rates, we selected crime data from the LAPD that spanned from 2010 to 2019. In this interactive dashboard, we summarized the data with a variety of descriptive statistics.
How we built it
We used a combination of different resources. For the interactive dashboard, we used Python and common libraries including NumPy, Pandas, Plotly, and Dash. For the four static visualizations of crime rate comparisons, Tableau translated our dataset into easily comprehensible graphs.
Challenges we ran into
Time. We had very limited time to plan and develop. Lack of clarity as to what has to be built at the beginning.
Accomplishments that we're proud of
We are proud of being able to network, learn and have fun while building our Viz with our team. We will keep learning, keep building and keep Vizathon-ing!
What we learned
Through our code and data analysis, our hypothesis that predictive policing algorithms inadvertently hurts people of color and those of lower socioeconomic status proved true.
What's next for Data Against Bias
We hope to continue building more advanced interactive visualizations and eventually integrating them into a website for easy access and sharing to educate others.


Log in or sign up for Devpost to join the conversation.