-
-

Input
-
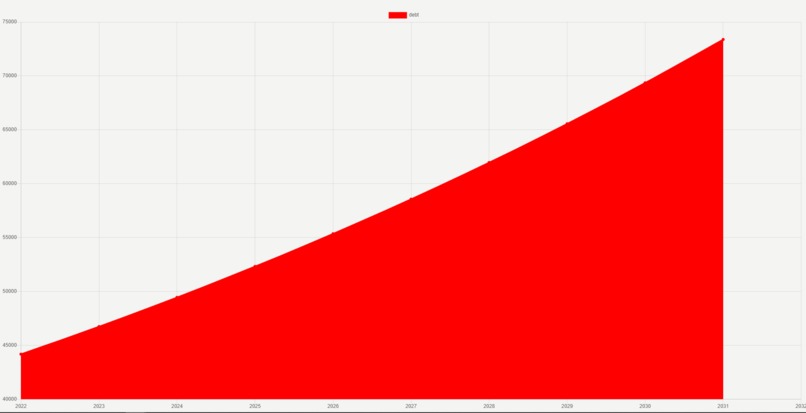
Chart


Inspiration
College students do not initially realize the financial commitment they're putting themselves through before seeking a loan. So we came up with the idea of a website to help them visualize their potential debt after graduation.
What it does
Debt Visualizer takes information such as expected graduation date and degree and creates a chart for the user showing how much debt they'll have after graduation if they choose to take a loan.
How I built it
We mainly used HTML, CSS, and Javascript. We used chart.js to produce the chart.
Challenges I ran into
The most difficult challenge was dynamically updating the chart as the user changes the input.
Accomplishments that I'm proud of
We managed to utilize chart.js and create a base chart for the user. We also managed to create and loop to update the "college type" input dynamically.
What I learned
We learned how to use js modules. We also have a deeper understanding of how javascript interacts with the browser.
What's next for Debt Visualizer
Create another graph for payments to show how long it takes for the average person to pay back the debt. To do this, we need to find the average debt payments relative to the individual's salary.


Log in or sign up for Devpost to join the conversation.