-
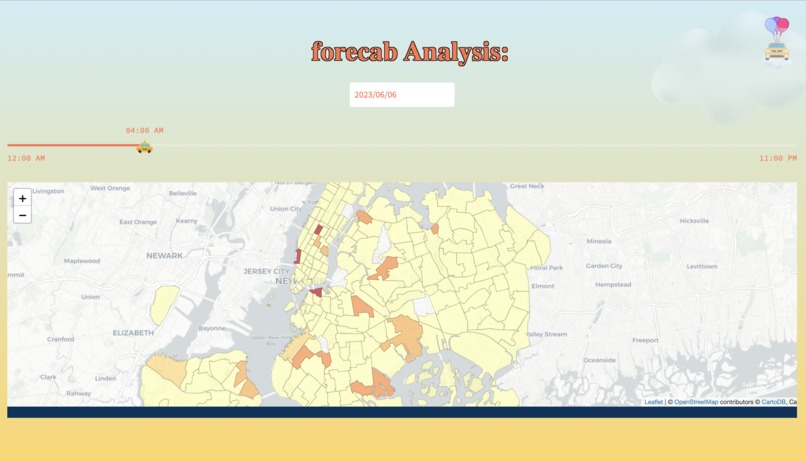
dawn outlook
-
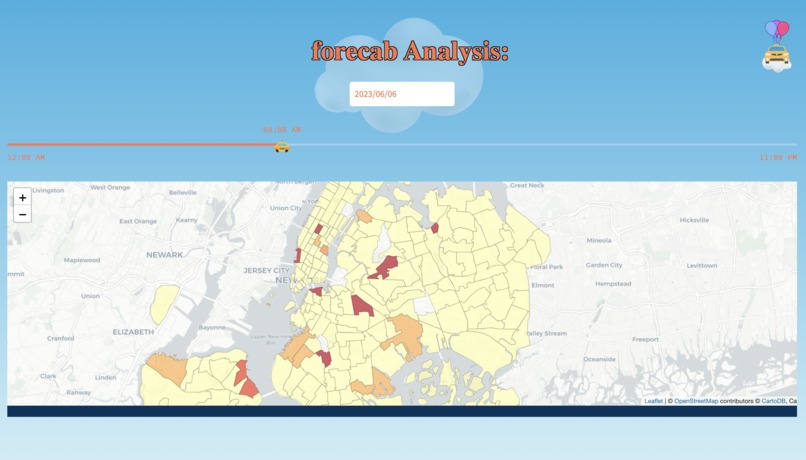
day outlook
-
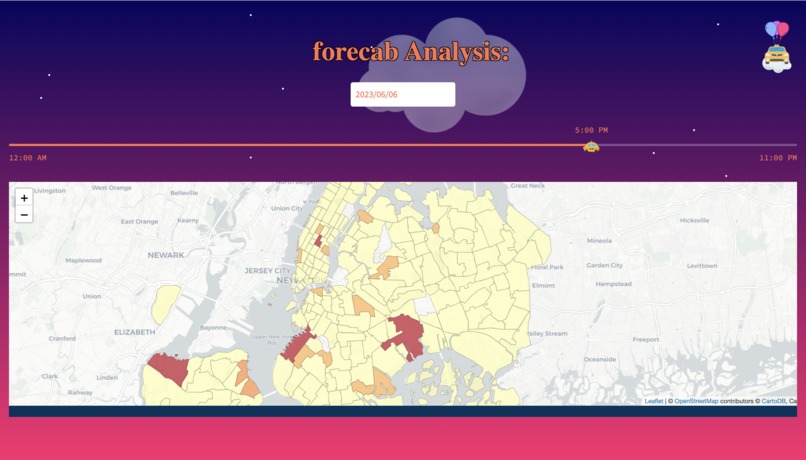
dusk outlook
-
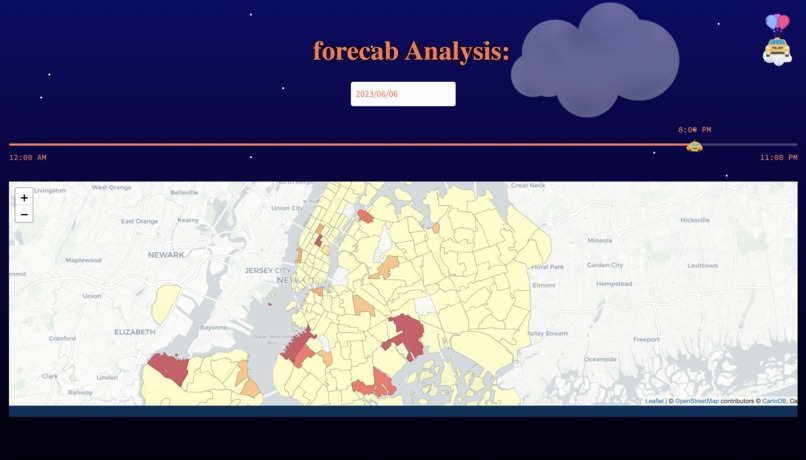
night outlook
-
forecab icon


Inspiration
As Rutgers Students, one of the biggest problems we face is the Rutgers bus system. Far too many times there are buses clumped up on 1 campus or 1 stop when the demand is somewhere else. Our team aims to solve this problem by building a machine learning system that accurately predicts transportation demand. Since Rutgers Bus data isn't readily available, we built our app using NYC Taxi data to show its capabilities and value. Our project aims to generate predictions such that we can adequately meet demand for various taxi zones (NYC is broken down into 263 taxi zones and it is very important for us to meet demand). The worst thing that could happen is that you have too little taxis in a high-demand zone and too many taxis in a low-demand zone.
What it does
Our software utilizes machine learning algorithms on the NYC Yellow Taxi Dataset to generate forecasts for taxi zones during specific time periods. Our model is able to provide us predictions for each zone, each hour, each day. This enables our users to retrieve predictions for each hour of the day and estimate pickup demand in every taxi zone in New York City. This would allow organizations (Transportation companies, etc) to be able to adequately meet demand for those zones.
How we built it
Our team was able to build our software utilizing the Python language. Python has an extensive amount of libraries for us to use, which were successful in deploying our software into a web-app.
In the front-end, we utilized Streamlit, a python app framework, to deploy our web-app and added customizable features with HTML and CSS. We successfully integrated the map and choropleth with the help of geopandas and folium, displaying all 263 zones in NYC.
In the back-end, we performed all data analysis and feature engineering using the pandas, numpy, matplotlib, and seaborn libraries. We analyzed over 200,000+ data points (each was a respective trip) to build a concrete dataset with engineered features based on relationships we saw. We then leveraged sklearn and catboost to build machine learning models such as gradient boosting trees and random forests for adequate prediction. We found that gradient boosting trees were the most optimal model.
Challenges we ran into
During the development process, we encountered many obstacles. We explored new libraries such as Streamlit, consulting documentation and other resources to establish the front-end. Due to limited customization options, we faced many challenges utlizing HTML and CSS into our application, since the framework does not directly support CSS integration, and had to get creative to achieve our desired visuals. We remained with Streamlit because of it's convenient widgets for input and its compatibility with displaying the map and overlaying the choropleth.
In the back-end, the biggest issue was how unorganized the data was. Due to the messiness, it was quite difficult to build a dataset ready for our ML models. Thus, there was a lot of time spent in cleaning the data and identifying the proper features that will help in our prediction task. Furthermore, building the final dataset was an issue since we had to format all the features correctly such that our pre-processing pipeline can work.
Accomplishments that we're proud of
With the assistance of Streamlit, we were able to design the front-end using nearly pure Python. This was our first time using this framework, and we are proud of having learned and implemented the successful web app using Streamlit.
We are also proud of being able to successfully build a ML model that can provide good predictions regarding hourly demand. Being able to connect these predictions to the frontend was definitely a challenge, but something that we are also proud of.
What we learned
Some of the things we learned were relating to how to connect the ML model's predictions to the frontend. There are various different ways to do this, but we did some research and found a solution that was fast and efficient. Furthermore, we learned how we can leverage ML to improve transportation. ML can help elevate cities to become Smart Cities and using ML for transportation is a key step in doing so.
Regarding the front end, we learned how to handle geospatial data and how to integrate it with our predictive data using geopandas dataframes and geojson files. We also became intimately familiar with the intricacies of front-end development while finding workarounds with CSS and HTML in order to bring our vision for the web app to the screen.
What's next for forcab
Next up, we would like to be able to take in NJ Transit data as well as Rutgers Bus data such that we push our solution to be useful for both students and the general population.

Log in or sign up for Devpost to join the conversation.