-
-
ecomate
-
-
-
-


Inspiration
Based off the 17 SDGs of the United Nations, this project has been made to promote conscious energy and water consumption. Being from India where water scarcity as well as high levels of energy and water consumption prevail , both mostly due to callous consumption practices has led me to think of this idea in the hopes that seeing their progress of consumption on the chart, how much it has increased or decreased over time, would prompt the users to make sustainable changes to their lifestyle.
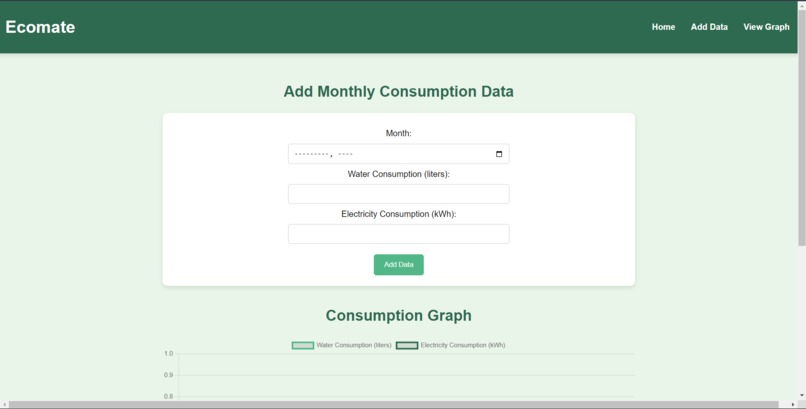
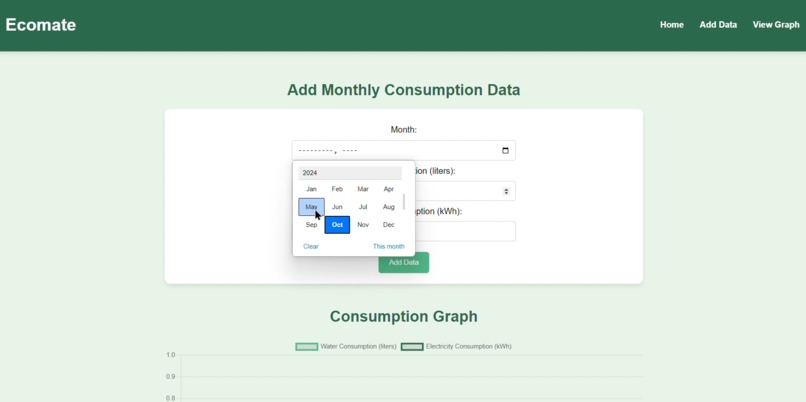
What it does
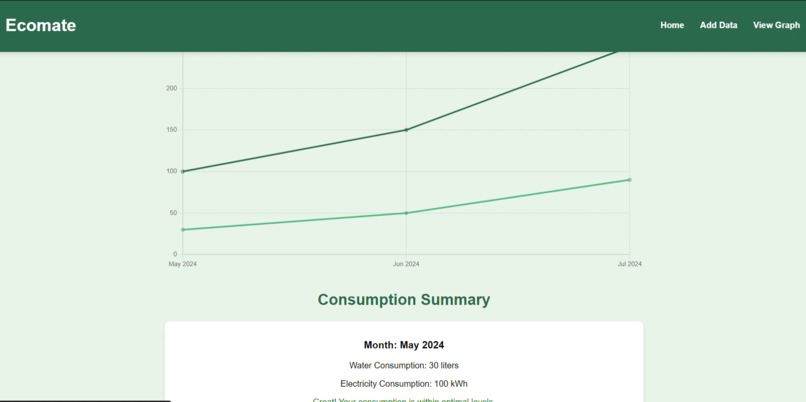
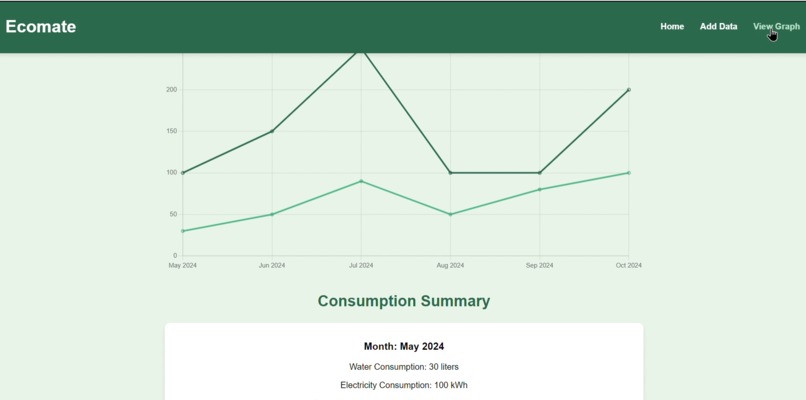
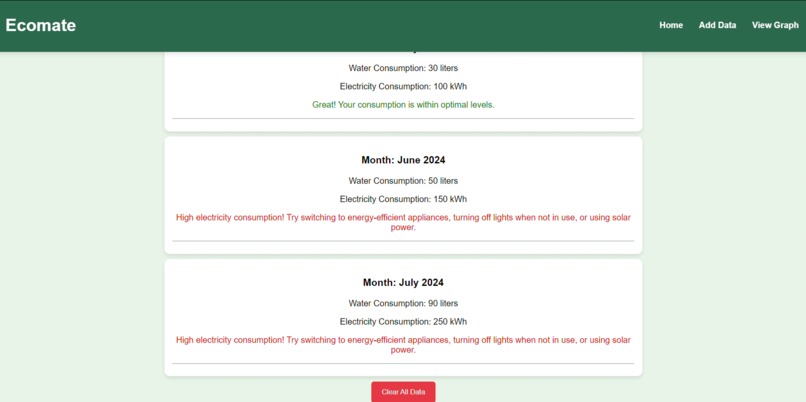
The user can input the data for energy and water consumed in the form of L and kwH for the months they want to track. The data is added to the queue and this data is presented on a graph which represent the progress of consumption over the months. If the consumption has increased, a message is displayed to the user that the levels are high and they should consider practising efficient energy or water conservation methods. If it is stable or less compared to previous months,then it is a good going.
How we built it
The website interface was build using HTML/CSS for user input and Javascript for providing data insights on their consumption and results based on the user input.
Challenges we ran into
A main challenge for myself while making this was using unfamiliar technologies such as using localStorage for storing of user entered data without the use of local database such as Express, which I got to know with the help of AI chat applications.
Accomplishments that we're proud of
Making this for a purpose that would forward a better cause which gave me the opportunity the learn new technologies.
What we learned
How to implement localStorage with a backend build based on Javascript
What's next for EcoMate
To add more functionalities such as having dashboard unique to each user

Log in or sign up for Devpost to join the conversation.