-
-
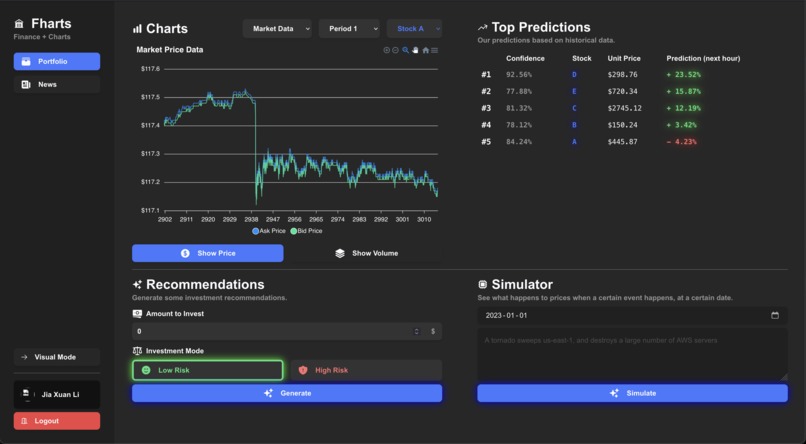
Main Portfolio
-
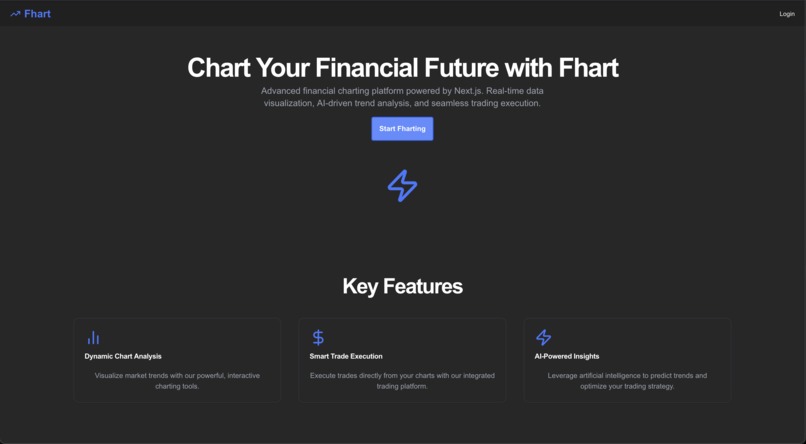
Landing Page
-
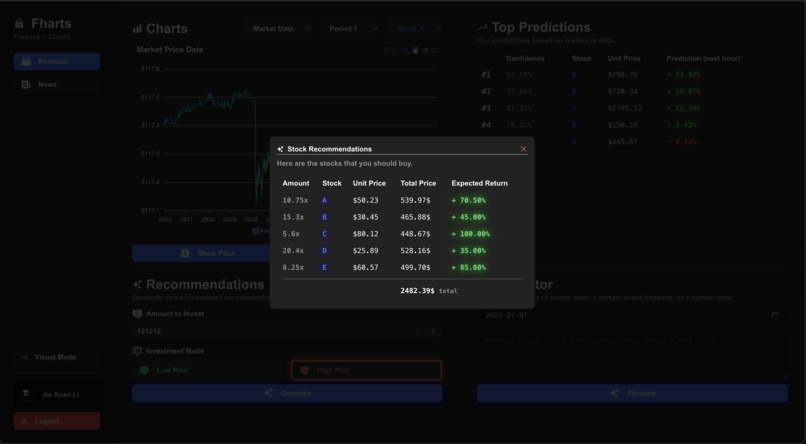
Stock Recommendation
-
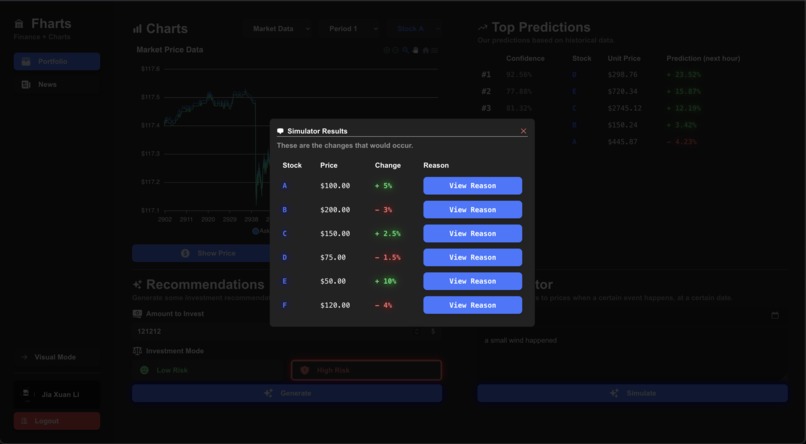
Stock Simulation
-
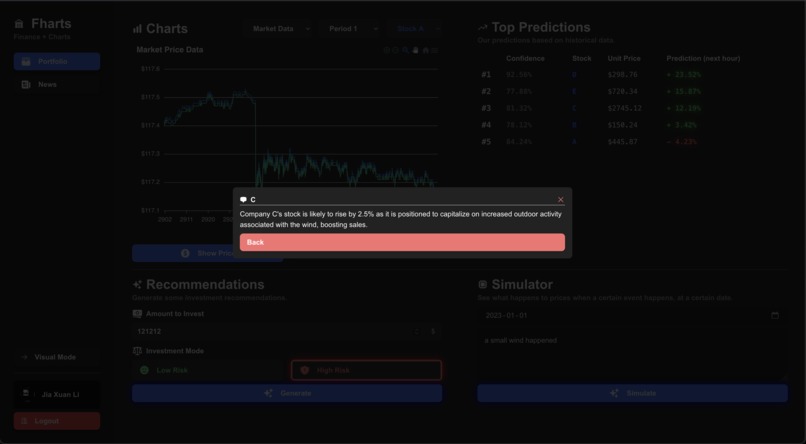
Stock Simulation (reason)


Inspiration
Helping people make good financial decisions, which makes the world a better place.
What it does
It retrieves information from National Bank's datasets, and displays them in a web interface, which is the data visualization tool. It was developed with plans to make predictions on stock prices, which will open it to lots of possibilities. Note that this is a proof of concept of what can be possible, if deployed within a larger scope.
How we built it
We used React to and ApexCharts to render the graphs, and Python libraries such as pandas and matplotlib to analyze the datasets at a glance. We planned on deploying scikit-learn to perform the predictions (possibly with SVM's).
Challenges we ran into
Loading massive datasets on a browser is resource-intensive, but it is the best way to make interactive displays, but here are the most challenging aspects we ran into:
- Parsing huge datasets with unfamilliar formatting, as most of our time was spent on parsing the datasets, and has less (no) time researching to develop a prediction algorithm.
Accomplishments that we're proud of
Although the app didn't meet our standards, the clean and minimalistic UI and the basic animation that were implemented on the web were great.
What we learned
We learned that sleep deprivation is bad, and that taking breaks is useful.
What's next for Fhart
Developing the actual algorithmic trading portion, and potentially increasing the scope of the project to include real stocks in real-time.


Log in or sign up for Devpost to join the conversation.