-
FINGRAPH
-
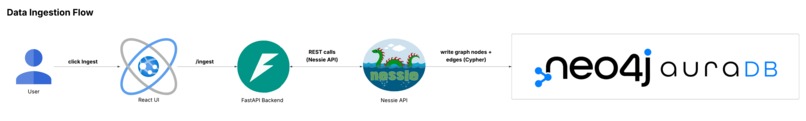
Data Ingestion Flowchart
-
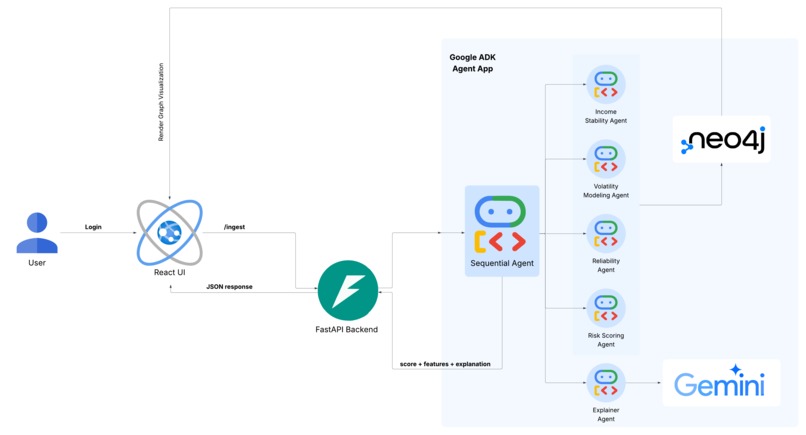
Architecture Diagram
-
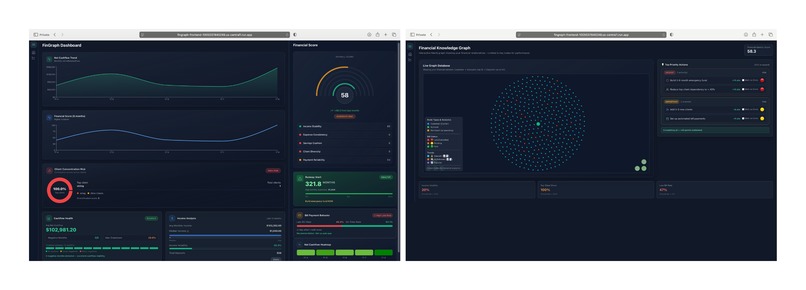
Freelancer 1 Profile
-
Freelancer 2 Profile


Introduction
On October 31st, 2023, Bloomberg reported that independent contractors and freelancers are increasingly essential—yet still sidelined by traditional finance:
“Freelancer reliance rises in U.S., with 20% of corporate work now done by them.”
Source: Bloomberg
Despite earning steadily, many freelancers continue to be flagged as “high-risk” simply because their income does not resemble W-2 employment.
A 2022 McKinsey report reinforced the scale of this shift:
36% of U.S. employed adults—58 million people—identify as independent workers.
Source: McKinsey & Company
Yet nearly 49% of gig and 1099 workers have been denied financial services they could afford, largely due to irregular or unverifiable income.
Source: Business Wire
Freelancers are financially active but remain structurally invisible. Their money flows across clients, subscriptions, transfers, bills, and merchants—patterns that behave like a graph, not a paycheck.
Traditional credit systems flatten this richness into a single number.
FinGraph exists to address this gap.
Inspiration, Problem and Why FinGraph ?
The idea originated from hearing the same story repeated across design, consulting, gig work, and creator communities:
“My income is stable, but the system still rejects me.”
This happens because legacy credit models expect:
- Single-employer income
- Predictable pay cycles
- Low spending variability
- Traditional bills and obligations
Freelancers violate these assumptions. Their financial behavior includes:
- Multi-sourced, asynchronous income
- Irregular bills and subscriptions
- Client concentration risk
- Month-to-month cashflow shifts
The issue isn’t poor financial behavior—it’s a model built for an outdated workforce.
FinGraph evaluates freelancers based on real behavior, not rigid templates.
Instead of asking “How much did you make?”, FinGraph asks:
- How stable is your income?
- How diversified are your clients?
- Which subscriptions drive expenses?
- How volatile is your cashflow?
- How much savings runway do you have?
These are graph questions.
How it works ?
1. Data Layer — Real Banking Data
FinGraph reconstructs a freelancer’s financial world using the Capital One Nessie API
→ http://api.nessieisreal.com/
All data—accounts, deposits, withdrawals, transfers, merchants, and bills—is modeled as nodes and relationships inside Neo4j AuraDB.
2. Intelligence Layer — Multi-Agent Reasoning (ADK)
On top of the graph, FinGraph runs a structured multi-agent pipeline using Google’s Agent Development Kit (ADK). The agents are:
- Income Stability Agent – income cycles and irregularity
- Volatility Modeling Agent – cashflow variance and drawdowns
- Reliability Agent – client concentration, late payments, subscriptions
- Risk Scoring Agent – Financial Identity Score + savings runway
- Explainer Agent – grounded narrative from structured metrics
Agents communicate through JSON-based state passing, ensuring the reasoning remains grounded in real data and avoids hallucinations.
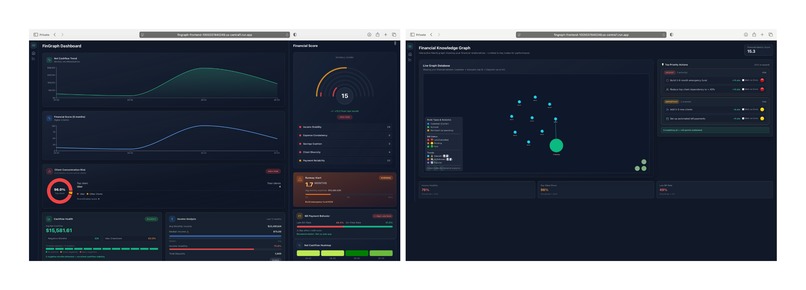
3. Application Layer — Dashboard
- Backend: Python + FastAPI + ADK
- Frontend: React + Neovis.js
- Deployment: Cloud Run
The dashboard presents:
- The Financial Identity Score
- Component breakdowns
- Timelines for income and cashflow
- Client concentration insights
- Savings runway
- An interactive Neo4j financial relationship graph
- Human-readable recommendations
Challenges we encountered
- Designing a unified graph schema from heterogeneous API data
- Writing precise Cypher queries to support our tools
- Constructing a multi-agent ADK pipeline with reliable state sharing
- Preventing LLM hallucinations
- Integrating ADK, Neo4j, FastAPI, and React cohesively
- Rendering large graph structures without overwhelming users
Every part required careful debugging and alignment across data, agents, and UI.
Conclusion
FinGraph reframes financial stability for a world increasingly powered by independent work. By combining graph databases, real banking data, and Gemini-powered multi-agent reasoning, it transforms fragmented transactions into a clear, human-centered Financial Identity. This isn’t a budgeting tool—it’s a new interpretation of financial identity itself, one that tells a story traditional credit scores never could.
Our approach naturally aligns with the goals of Technica, Intuit, Capital One, and MLH: we use AI responsibly, apply real financial data to solve an underserved problem, promote transparency and fairness, and build inclusive technology that empowers freelancers.
Accomplishments
- Fully working multi-agent reasoning pipeline
- Real financial graph from Nessie API ( ~87,000 accounts processed )
- Transparent scoring model
- Clean, fast dashboard ( < 4 seconds)
- Integrated explainability across all steps
What we learned
We learned to design graph-based financial models, orchestrate multi-agent LLM systems, generate grounded explanations, and build real-time analytics pipelines.
What's next for FinGraph
- Forecasting income and expenses
- Scenario simulation (“What if my top client leaves?”)
- Multi-bank support
- Personalized guidance beyond scoring
- Adaptive user insights
Testing Credentials
For evaluation and demonstration purposes, the following sample credentials have been provided.
Credential 1: Username: [email protected] Password: f20dd5184160
Credential 2: Username: electronic [email protected] Password: 35571461272f
Please note that these credentials are intended only for testing in a controlled environment and do not provide access to any production-level or sensitive information.


Log in or sign up for Devpost to join the conversation.