-
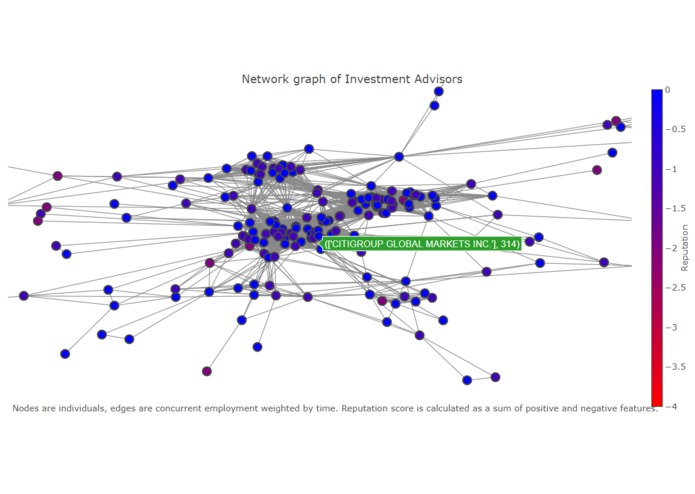
Network Graph of Investment Advisors
-
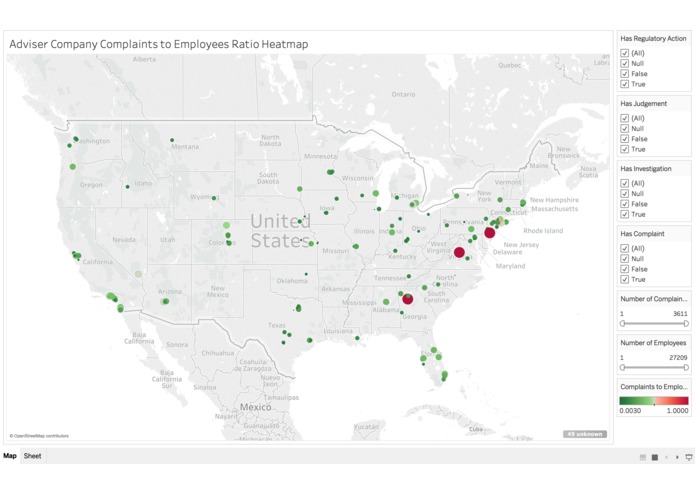
Characteristics of Advisors and Location
-
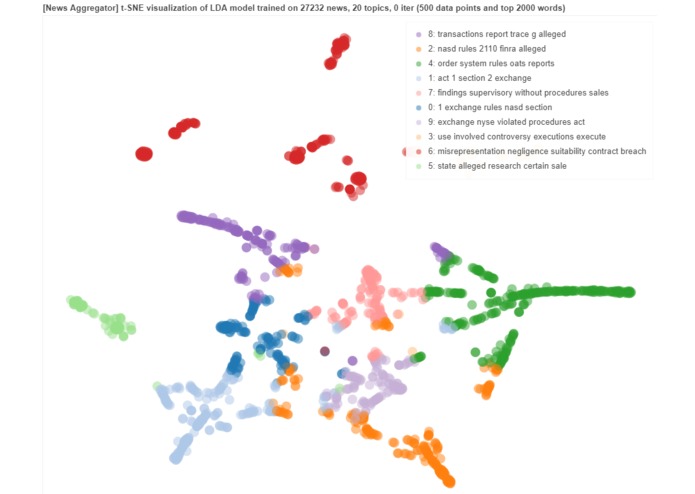
Disclosure Files Grouped by Topical Similarity


Inspiration
We're a team interested in finance and data science, and lucky for us, FINRA was giving out a challenge for analyzing financial data! Originally we planned to build an app that searches and displays data on every advisor, but FINRA already has an excellent tool for that (BrokerCheck). Instead, we wanted to create a product that could provide actual value to FINRA, which could help them find potentially deceitful advisors for conducting audits.
What it does
Visualizes financial advisors as a network graph, with their coworker networks representing weighted edges (by duration), and colored by their reputations (e.g criminal or bankruptcy history). The second tool performs unsupervised text analysis on firms' disclosure reports to discover topical similarity, and visualizes them as clusters. Points can be filtered by date.
How I built it
Out platform was Google cloud datalab and Jupyter. We used xml etree and Pandas for the data processing, Plotly and Bokeh for the plots. Gensim's implementation of multicore LDA was used for the topic modelling. Networkx was used to model the network graph and layout.
Challenges I ran into
Finding insights of value in the data - originally we wanted to cluster advisors by reputation, but the features weren't descriptive enough. We tried getting more data on the number of complaints per advisor, but they were stored as PDFs, which were a bit of a pain to parse to text. Parsing the XML into a 2D dataframe was difficult due to its hierarchical structure, in the end we settled with Python dictionaries.
Accomplishments that I'm proud of
Overall we were satisfied with the quality of the visualizations.
What I learned
Topic modelling, plotting, Pandas
What's next for FINRA Insights
Investment research project


Log in or sign up for Devpost to join the conversation.