-
-
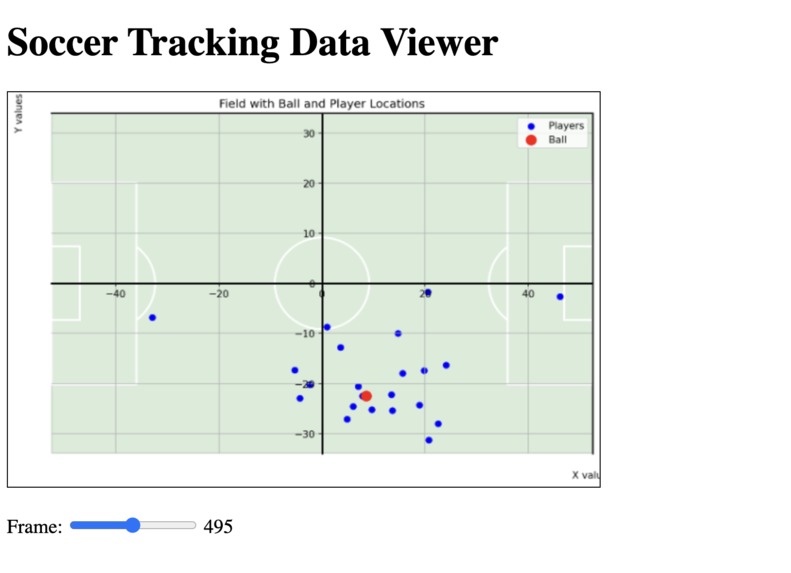
Still image of Frame Visualizer

Inspiration
This project was based on the challenge issued by U.S. Soccer and based on the data provided by SkillCorner.
What it does
The project visualizes the positional data of the players and the ball of one match at each frame. The frame can be controlled by a slider from frame 1 to 1000.
How we built it
The project was built in Python, using Pandas to extract the data into a data frame and visualized in a scatterplot stylized to look like a soccer field. The point corresponding to the ball was colored in red while the points corresponding to the players were colored blue to differentiate the two types of objects.
Challenges we ran into
Due to our inexperience with projects, much of the time was dedicated to researching tools that we could use to extract the data and visualize it. We discovered that Pandas could extract the data from the Github page and Matplot could stylize a scatterplot to allow for better user interface.
Accomplishments that we're proud of
- Creating a functional project within the time limit.
- Successfully using resources such as Matplot and Pandas ## What we learned We learned about how to extract data from public repositories as well as ways to visualize data. This will allow us to implement our solutions much more quickly in the future rather than waste time figuring out the tools. ## What's next for Frame Visualization
- Differentiation of teams as well as identification of individual players.
- More intuitive frame control mechanisms, such as typing in certain frames or using timestamps rather than frames.
- Video playback of chosen excerpts.
- Saving of images, gifs, or videos.
- Usage of the Kloppy resource provided by SkillCorner to make use of a visualizer much better suited for the data.
- Usage of data other than location such as ball possession, goals made, and total score to give a fully-fledged overview of the game.


Log in or sign up for Devpost to join the conversation.