-
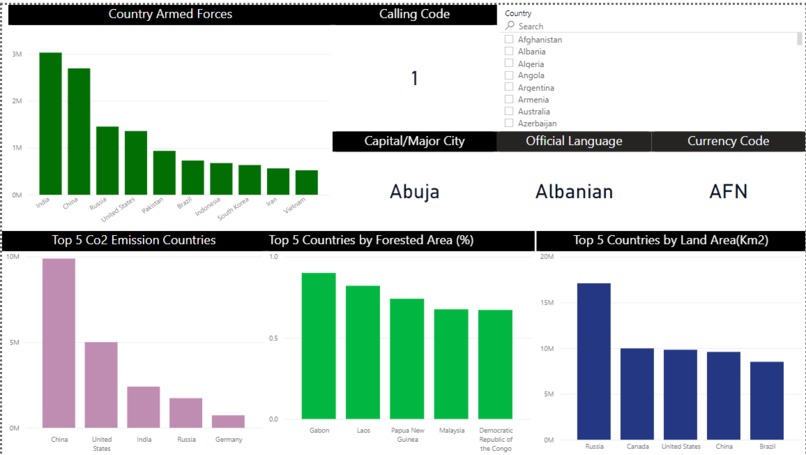
KPI's
-
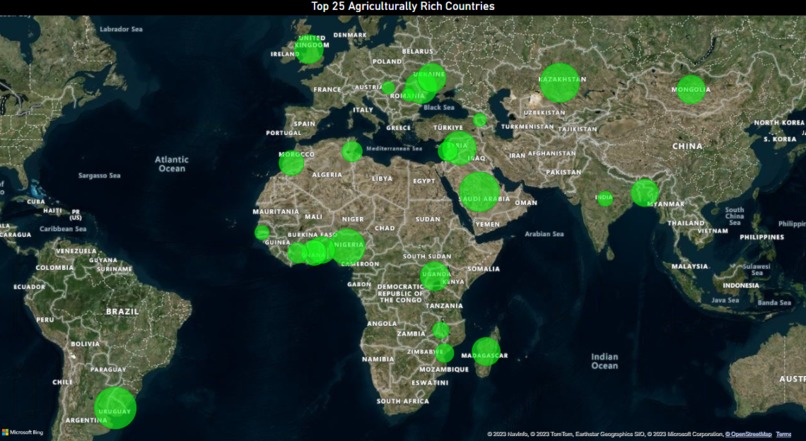
Top 25 Agriculturally Rich Countries


Inspiration
The inspiration behind creating the Power BI Dashboard on global data was to provide a comprehensive and visually engaging platform to explore and analyze various key indicators from different countries. We aimed to present a holistic view of global trends and patterns that could help policymakers, researchers, and individuals gain valuable insights into the world's economic, social, and environmental landscape.
What it does
The Power BI Dashboard on global data showcases a collection of essential Key Performance Indicators (KPIs) from countries around the world. Users can interact with the dashboard, exploring data related to Gross Domestic Product (GDP), Human Development Index (HDI), Unemployment Rate, Education Enrollment Rates, Healthcare Expenditure, and more. The dashboard facilitates dynamic data visualization through interactive charts, maps, and filters, allowing users to drill down into specific regions and time periods.
How we built it
We built the Power BI Dashboard using Microsoft Power BI, leveraging its robust data transformation capabilities and extensive visualization options. The data was sourced from reputable international organizations and government publications, ensuring data accuracy and reliability. After cleansing and preprocessing the data, we created relationships between relevant datasets to enable seamless data exploration.
The visual elements of the dashboard were thoughtfully designed, combining a harmonious color scheme, intuitive icons, and a user-friendly layout. We utilized Power BI's interactive features, such as slicers and cross-filtering, to enhance user experience and allow for dynamic data exploration.
Challenges we ran into
One of the main challenges we encountered was sourcing reliable and consistent data from various countries with different reporting standards. Data cleaning and normalization required meticulous attention to detail to ensure data accuracy and consistency across the dashboard. Additionally, integrating diverse datasets and optimizing the dashboard's performance while handling large data volumes posed technical challenges.
Designing a visually appealing and user-friendly interface that accommodates various user requirements and preferences was another significant challenge. We worked iteratively to strike a balance between aesthetics and functionality.
Accomplishments that we're proud of
Despite the challenges faced, we are proud to have developed a powerful and insightful Power BI Dashboard on global data. The dashboard provides an intuitive and engaging user experience, enabling users to gain valuable insights into key global trends effortlessly. We successfully incorporated a wide range of KPIs from different domains, offering a holistic view of various aspects of country-level development.
What we learned
Through this project, we deepened our understanding of data visualization best practices, data preprocessing techniques, and Power BI's capabilities. We also honed our skills in data analysis, chart selection, and interactive dashboard design. Moreover, we learned the importance of data quality and the challenges associated with integrating data from diverse sources.
What's next for Untitled
Moving forward, we plan to expand the scope of the dashboard by incorporating additional KPIs and integrating more real-time data sources where possible. We will continuously update the dashboard to ensure that users have access to the most recent and relevant information. Additionally, we seek to gather feedback from users to make iterative improvements, enhancing the dashboard's value and usability. Ultimately, we aim to make the dashboard a go-to tool for anyone seeking insights into global trends and development indicators.
Built With
- powerbi


Log in or sign up for Devpost to join the conversation.