-
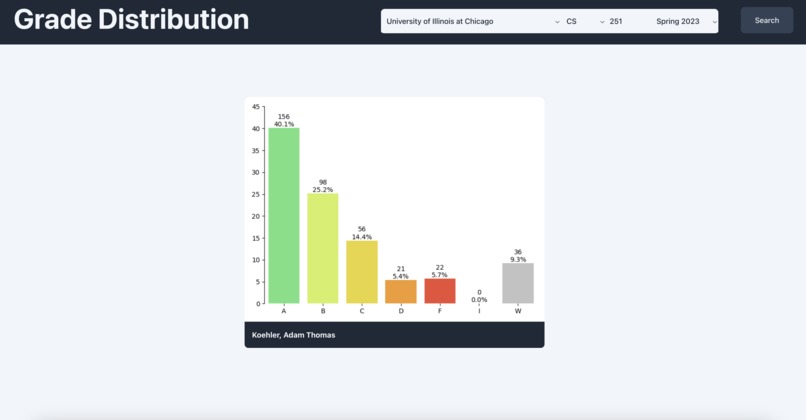
Getting a plot for the course with one section
-
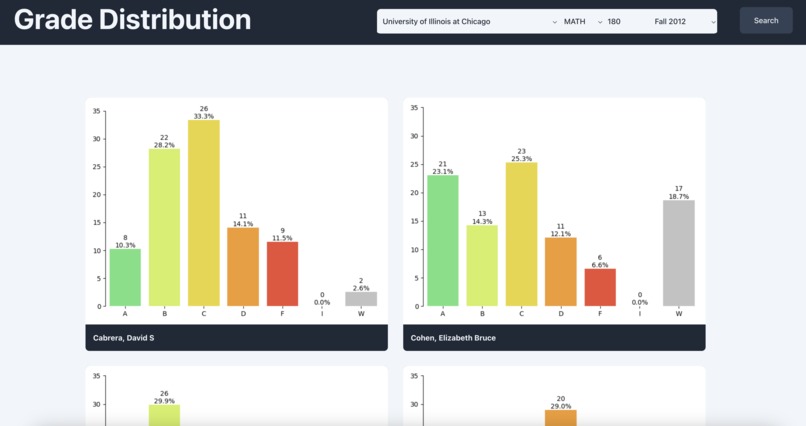
Getting plots for the course with multiple sections
-
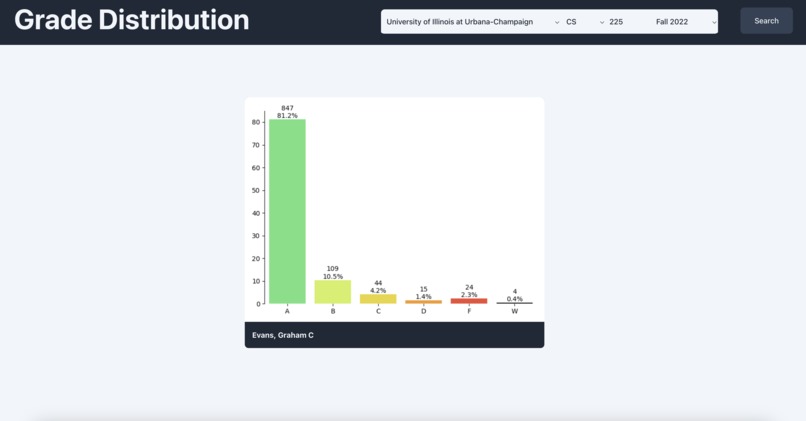
Getting a plot for the course with one section for another school
-
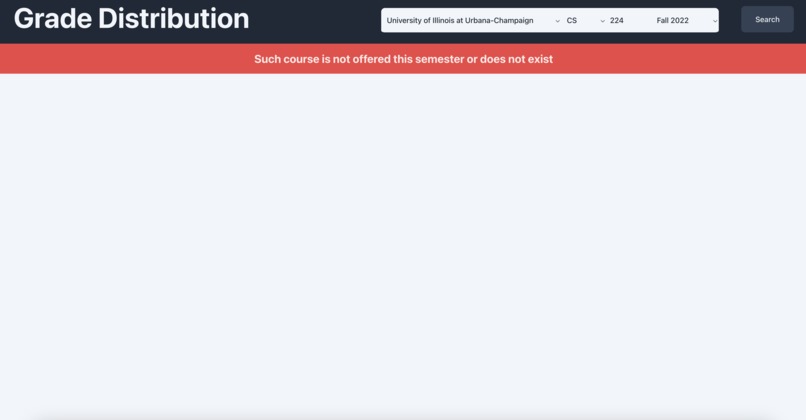
Course does not exists or not offered that semester
-
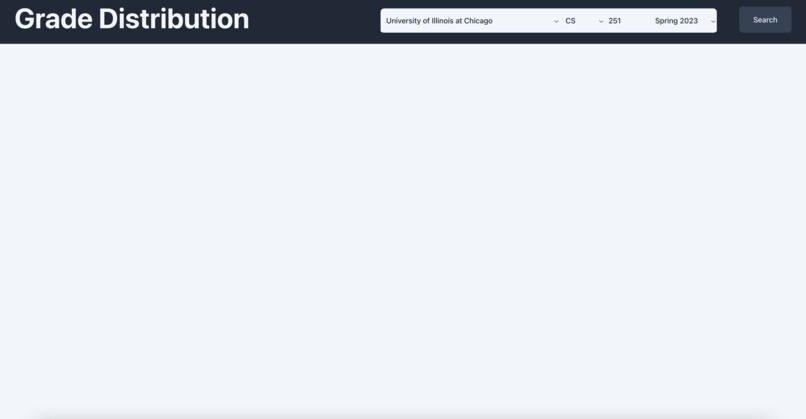
Inputting arguments by the user
-
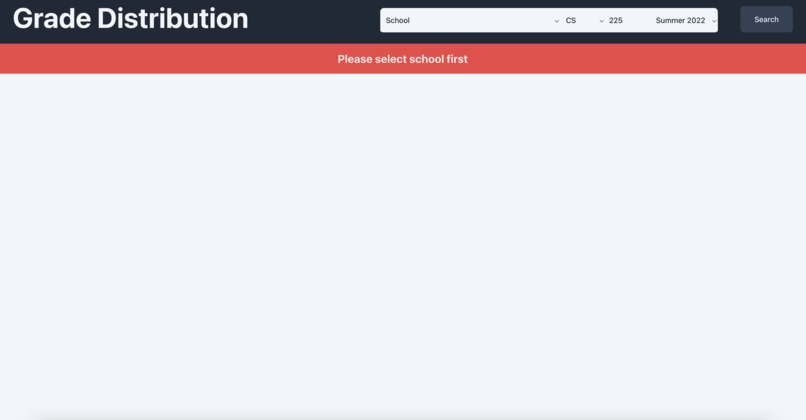
Do not forget all arguments


Inspiration:
Scheduling classes can be a difficult experience, and many students want to be able to choose a good professor. It also a good tool to discuss grade inflation and injustice in grading.
What it does:
Allows students to view courses at their chosen university and see the grade distribution from previous semesters, and what professor taught it.
How we built it:
The frontend of the website was build using React and JavaScript, and the website's styling was complimented with Tailwind CSS. The backend of the website was built with Python and Flask and was using various Python libraries, most importantly, Matplotlib, Pandas and Seaborn, for data processing, analysis, and visualization. The datasets are stored on the server side in csv files sorted by folders for a fast retrieval.
Challenges we ran into:
Designing a website that is easy for the user to read, implementing the backend-created API for the frontend. Creating a system to compactly store a huge amount of data that is quick to access. Connecting the backend and the frontend seamlessly to achieve smooth experience for the user and easy life for the server without errors and unexpected events.
Accomplishments that we're proud of:
Having such a large data pool for our project, as well as being able to display grade distribution data in a readable and easy to understand manner, yet getting it fast without a lot of computation or excess memory use.
What we learned:
We gained a greater understanding of React frontend and Flask backend, and good web-design techniques and practices. As well, we learned how to coordinate efforts to work on the project in the parallel using tools like Git and GitHub.
What's next for Grade Distribution:
Adding even more universities. Implementing teacher rankings? Adding reviews? Grade inflation score? Who knows...
Built With
- flask
- javascript
- matplotlib
- pandas
- python
- react
- seaborn
- tailwind

Log in or sign up for Devpost to join the conversation.