-
-
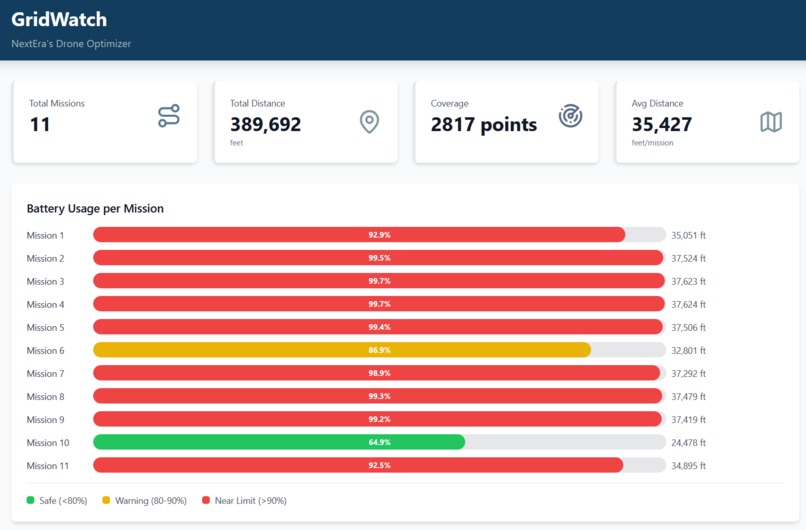
Drone Breakdown
-
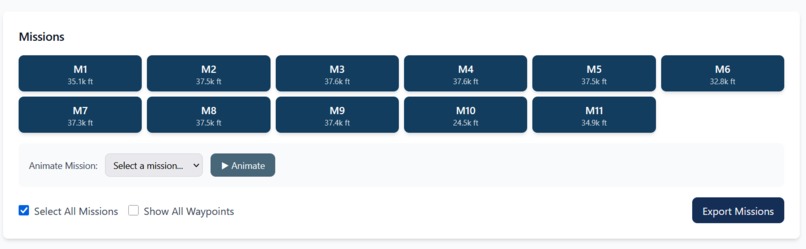
Mission & Animation Selector
-
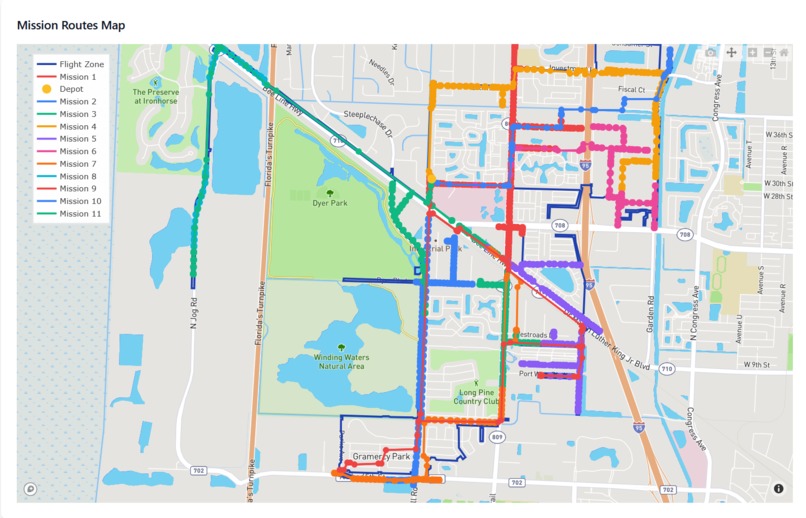
Mapbox Display
-
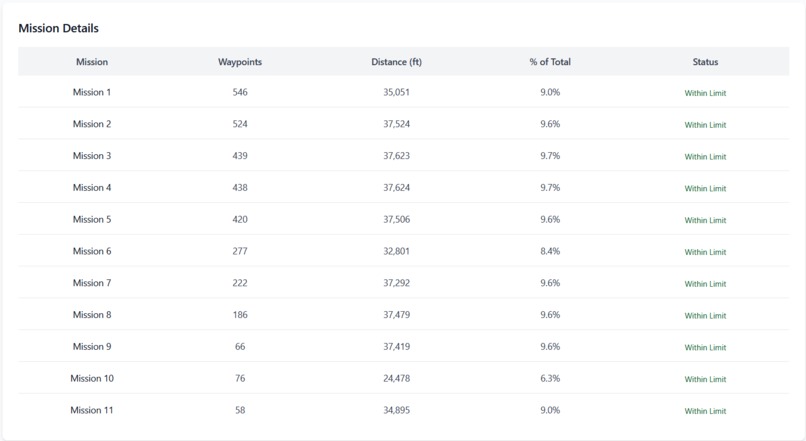
Breakdown Table
-
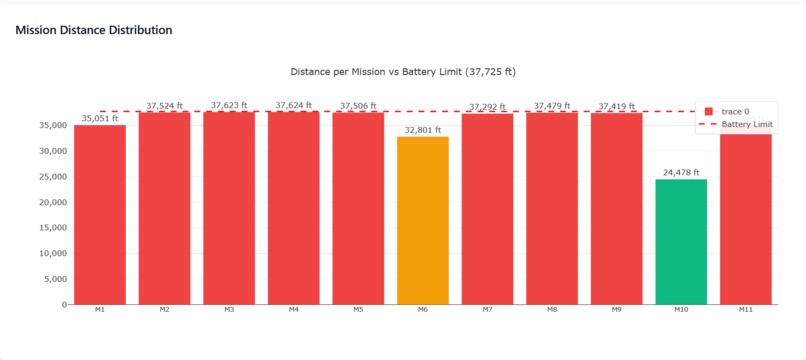
Bar Chart


Inspiration
NextEra and FPL annually cover and support the infrastructure of millions of Floridians but also Americans nationwide. We realized that even small efficiency gains in route planning could translate to real-world impact. Every second counts and if we can help improve the response time in understanding the current status of an area, we believe that it can help contribute to grid resilience and keep the lights on more reliably across Florida.
What it does
Our solution uses Google OR-Tools to solve the Vehicle Routing Problem by assigning waypoints to missions while minimizing total flight distance. The algorithm accounts for actual navigable paths between poles rather than straight-line distances, ensuring routes reflect real operational constraints. It automatically determines the minimum number of missions needed to cover all inspection points while keeping each flight safely within battery capacity.
The dashboard visualizes all mission routes on an integrated map, allowing operators to analyze individual flights, monitor battery consumption, and simulate complete flight paths through route animation. Color-coded battery indicators warn when missions approach capacity limits, and detailed statistics show waypoint counts, distance distributions, and coverage percentages.
How we built it
Backend Optimization Engine:
-Python with Google OR-Tools for Vehicle Routing Problem solving
-NumPy for efficient distance matrix operations and spatial calculations
-GeoPandas and Shapely for polygon boundary enforcement and geographic constraints
-Custom route expansion algorithm using predecessor matrices to reconstruct complete paths from compressed waypoint sequences
-Caching system with Dill to store solutions and avoid redundant calculations
-Flask API server to expose optimized routes as JSON endpoints
Optimization Pipeline:
-Load pre-calculated distance matrices and waypoint indices
-Build routing model with battery constraints (37,725 ft max per mission)
-Apply photo indexes for initial solution in abstract space.
-Use predecessor to make intermediate solution between waypoints.
-Use points_lat_long to expand into full waypoint sequences on a coordinate plane.
-Export mission data as structured JSON for frontend consumption
Frontend Dashboard:
-React
-Plotly.js with Mapbox integration for geographic visualization
-Axios for communication between frontend and backend
-Animation system using requestAnimationFrame for route playback
-Memoized data processing to optimize rendering performance
-Tailwind CSS
Key Technical Decisions:
-Used pre-computed Dijkstra matrices to avoid recalculating paths for the predecessor
-Implemented iterative vehicle count increase to find minimum missions needed
-Cached solutions to enable rapid iteration during development
-Separated concerns between optimization (backend) and visualization (frontend)
Challenges we ran into
Balancing route efficiency and battery conservation was harder than we expected. We had to account for realistic flight paths requiring integration of predecessor matrices to expand compressed routes. Managing WebGL rendering performance with thousands of waypoints kept crashing the frontend so we had to implement memoization and caching strategies to support this load. The iterative vehicle count approach also required tuning the time limits and search parameters to find realistic solutions within reasonable computation times. Handling the animation system while maintaining map interactivity also proved to be difficult to prevent UI conflicts.
Accomplishments that we're proud of
We had limited experience working with Python starting this hackathon but by challenging ourselves we successfully implemented a routing algorithm that optimizes thousands of waypoints while respecting battery usage. Our predecessor matrix expansion system accurately reconstructs complete flight paths from compressed route representations. The interactive dashboard provides real-time mission analysis with animations and various tables/graphs. We achieved efficient rendering performance despite processing thousands of geographic data points. The caching system enables rapid iteration and testing of different optimization parameters.
What we learned
This project deepened our understanding of Vehicle Routing Problems and the practical challenges of applying optimization algorithms to real-world constraints. We learned how to use Google OR-Tools for complex routing scenarios and the importance of preprocessing data (distance matrices, predecessor graphs) to enable faster optimization. The integration of geographic data with optimization algorithms taught us valuable lessons about coordinate systems and spatial calculations. We also gained experience building a full-stack systems that connected a backend with a interactive frontend.
What's next for GridWatch
This challenge only considers a small data set with a lot of considerations waived such battery degradation, wind, and weather. We would love to rebuild parts of our pipeline to support a continuous stream of data rather than just a small snapshot. One final addition would be to improve the path animation to be less choppy and improve the map interaction.


Log in or sign up for Devpost to join the conversation.