-
-
home page

Inspiration
Our inspiration for Mapnosis comes from an understanding of how environmental issues can have detrimental impacts on individuals. This is especially true for marginalized and minority groups, where they are most likely to be breathing in contaminated air and dealing with other pollutants, sometimes without knowing. The idea of Mapnosis is to provide a free and easy-to-use tool to the general public that would help mitigate some of the negative effects of our worsening environments. We hope to inform others of the potentially hazardous airborne particulate matter near them and determine the levels of risk that it poses in a given area. Many people are not aware that the air they are breathing could be making them sick, contributing to their allergies, or raising their risks of contracting cardiovascular diseases. It is important to bring awareness to the effects of airborne particles on the community to help people, particularly those who are already vulnerable, to stay informed about the environmental conditions near them in order to avoid negative effects associated with long or short-term exposure to these particles.
How to Use
The website is relatively easy to use, which increases its effectiveness. With minimal styling on the website, navigating it and retrieving the information you want is simple.
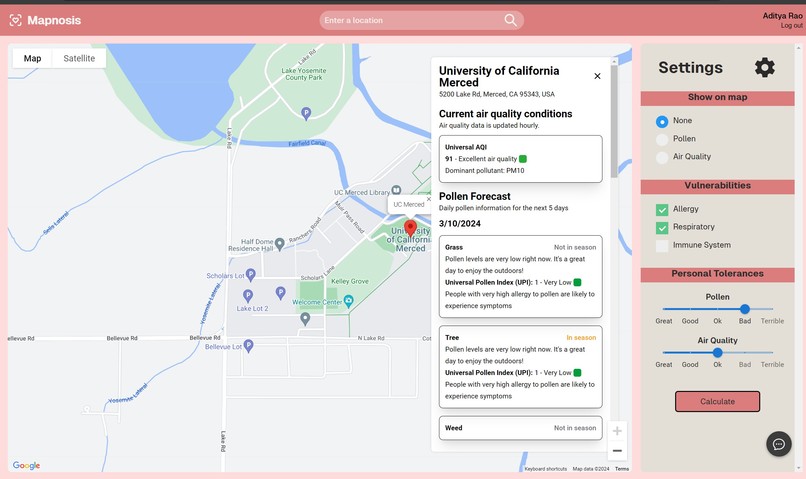
Upon entering the website, you will be presented with an interactive map. This gives a visual source of information, a canvas with which we paint onto air quality index and pollen concentration heatmap data.
These visual representations are togglable on our small sidebar positioned to the right of the map. Here you can choose between heat maps of pollen levels, air quality, or a default map. The rest of the sidebar allows users to submit their data to tailor the website's information to their specific case. Users can select certain medical conditions they possess as well as personal tolerance levels which represent an individual's understanding of their body and what level of pollen and air quality they can manage. At the bottom of the sidebar is a calculated button, which when clicked, will generate a summary of the pollen concentration and air quality of a location at the current time. In addition, a simple recommendation is given on whether or not it is advisable to go outside based on user-provided location, pollen concentration, and air quality preferences.
The information must be contextualized with a specific location, which is the purpose serviced by the search bar at the top of the page. Here users can enter the location of their choosing. Upon entering it, a pop-up will appear with five-day forecasts of the pollen and air quality data (when available).
How We Built the Project / Challenges Faced
🌐 Frontend: React, Javascript, HTML/CSS, Botpress
🛠️ Backend: MongoDB Atlas, Express.js
The front end of this project was created using React, which was utilized in creating the layout of the site. The backend languages used in this program are Express.js and MongoDB. This was used to code the interactive map, particularly the pollen and air quality settings. Auth0 was used to create the login authentication and store data within the site. GoDaddy provided the domain that we used for our site that we deployed to Vercel.
During this hackathon, we were able to utilize MongoDB to store authentication information for the users on our site. We were also able to implement Google Pollen and AQI API data into our map, along with the search feature. We also used React to create many of the frontend UI elements in the website, strengthening our proficiency in Javascript XML (JSX). One challenge we faced was creating the map overlay for pollen under the “Show on map” section. There was a set opacity function in the image, which had to be corrected for the pollen heatmap overlay appropriately.
There were also minor issues such as figuring out how to add variables to account for vulnerabilities and personal tolerances (and link them to the MongoDB database), and certain countries crashing due to pollen API errors, which gave invalid argument messages. Learning to deal with these issues made the team more familiar with backend development and will prove useful in the future, as it reinforces good programming habits.
What's next for Mapnosis
Configure further machine learning integrations with MongoDB, and use artificial intelligence to provide users with custom feedback based on personal preferences.
Built With
- amazon-web-services
- auth0
- css
- express.js
- google-maps
- google-pollen-api
- html
- javascript
- mongodb
- node.js
- openapi
- react


Log in or sign up for Devpost to join the conversation.