-

View midway through the visualization.
-
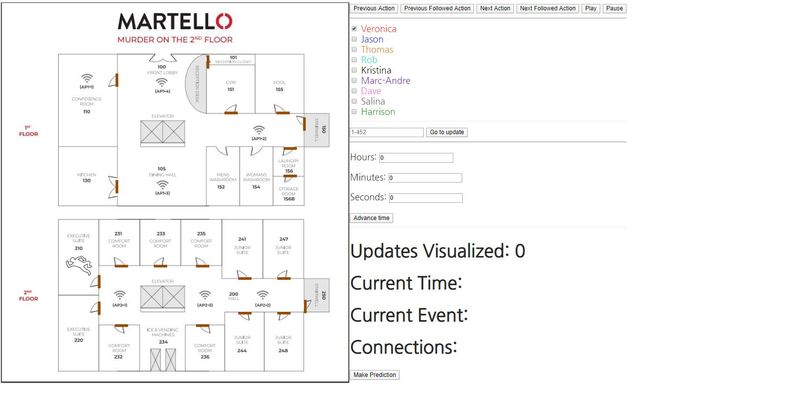
Starting view.
-

Suspect prediction view.


What it does
Our website creates a visualization for the dataset given to us for the challenge. Allowing the murder suspects to be tracked easily.
How we built it
We wrote a simple Node.JS backend to host the website and modify/serve the dataset and created a frontend with a heavy use of JavaScript to generate the visualization for this project.
Challenges we ran into
We ran into problems with the dataset not matching what the challenge's README said it would be, though we just made safe assumptions about the challenge to get around that.
What we learned
We learned that visualizing data makes it considerably easier to understand as opposed to reading plain text, showing us the importance of data representation.

Log in or sign up for Devpost to join the conversation.