-
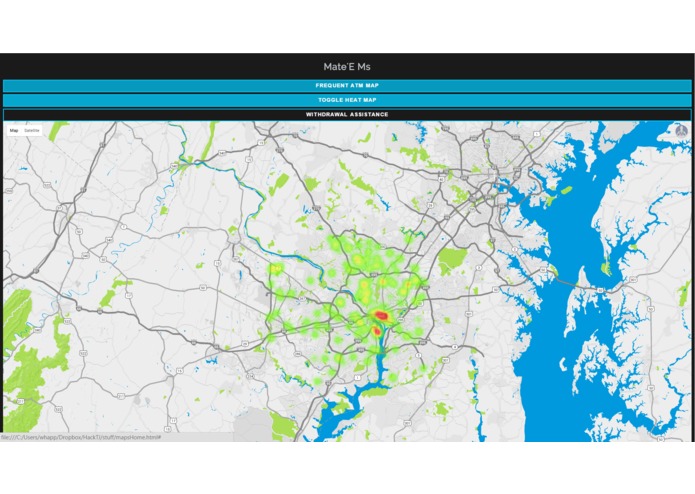
Heat Map
-
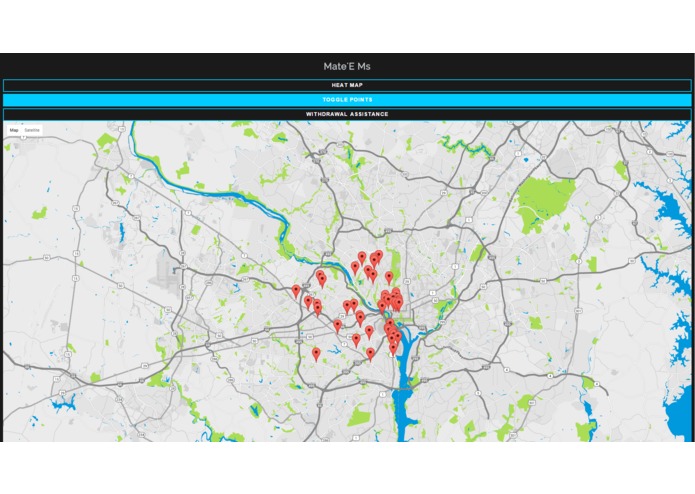
Frequent ATM Map


Inspiration
We wanted to create a project that showed off data in a visually appealing manner. We were really inspired by
What it does
Mate'E Ms shows off a heat map of the number of ATMs in any specified area, as well as customer traffic in that area. The Mate'E displays information on accessibility of ATMs and the geolocation of them as well, indicated by markers on an interactive map.
How I built it
We built this project using html5 and css3 for styling, with the core functions being performed using javascript and the google maps and nessie apis.
Challenges I ran into
All of the languages we used were completely unfamiliar and we struggled to create a streamlined project.
Accomplishments that I'm proud of
I'm proud of the heat map we created, as well as the merchant system that represented shops.
What I learned
I learned about implementing apis, as well as the use of javascript and bugfixing.
What's next for Mate'E Ms
There may be future plans, such as withdrawal assistance, and the heat mapping of atm transactions.
Log in or sign up for Devpost to join the conversation.