-
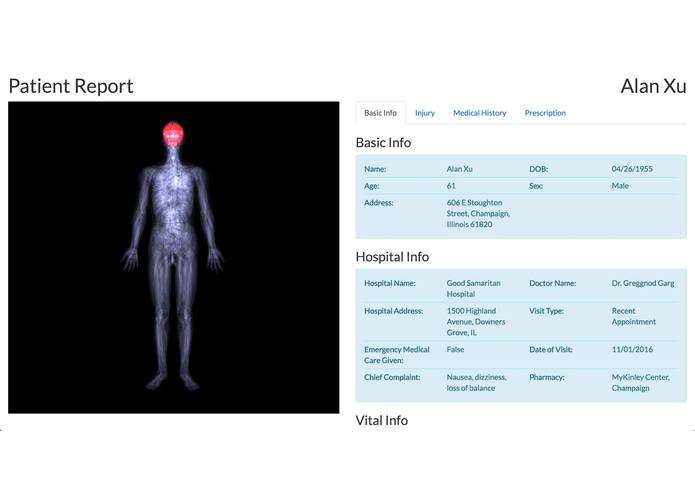
Overall report for Alan Xu.
-
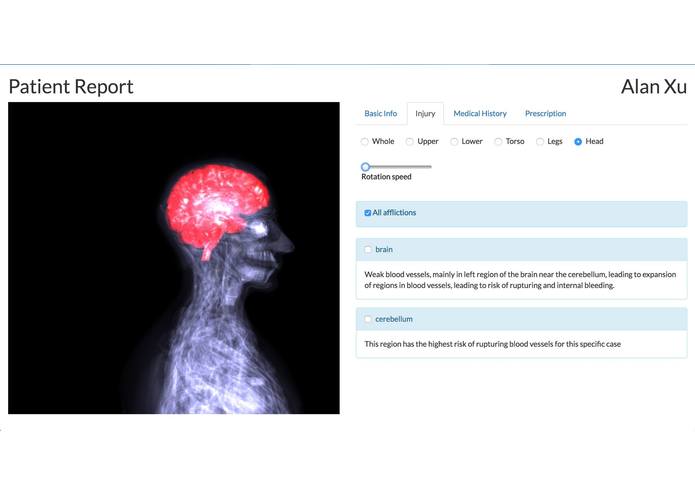
Our interface 3D models Patient Alan Xu's area of injury as well as documents his diagnoses and subsequent treatment.
-
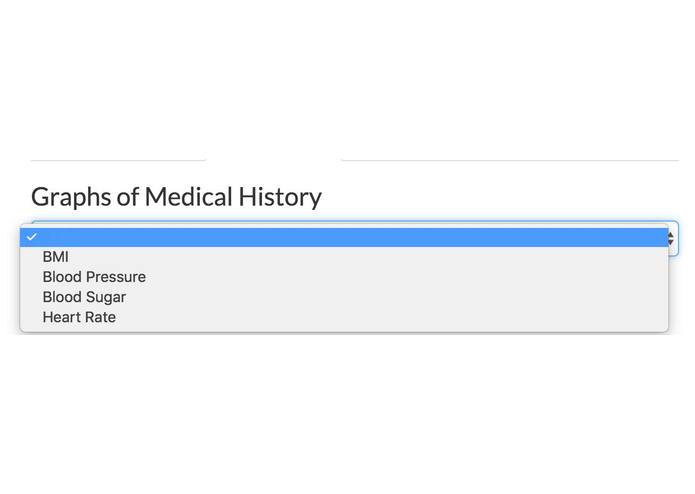
Our interface graphically illustrates important patient medical history.
-
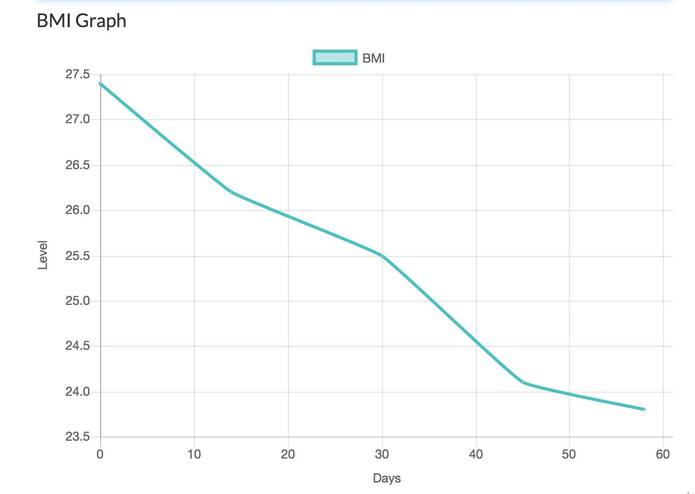
Patient Alan Xu's BMI medical history.
-
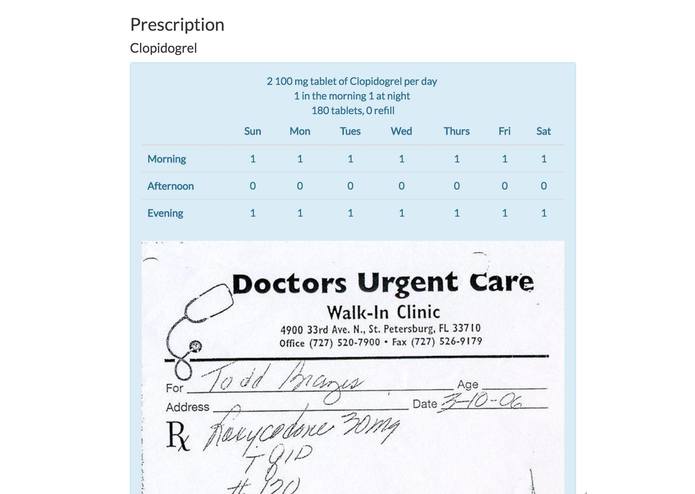
Patient Jason Wuman's prescription recommendations from his doctor.
-
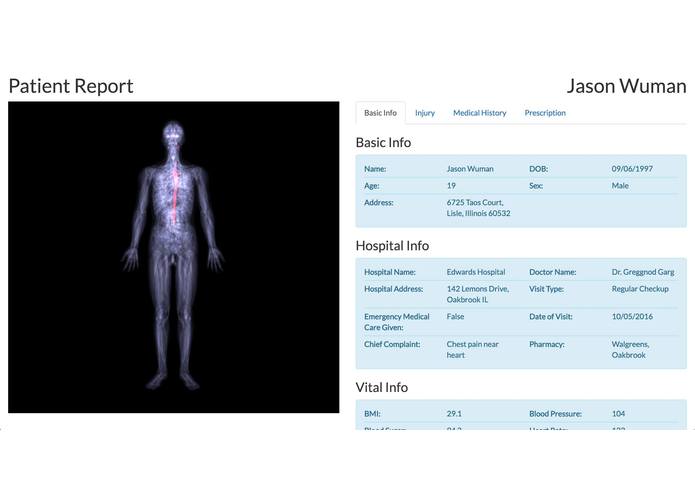
Overall report for Jason Wuman.
-
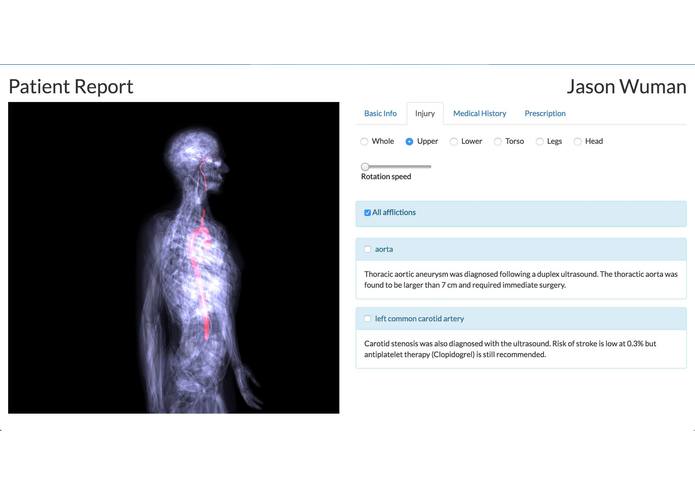
Our interface 3D models Patient Jason Wuman's area of injury as well as documents his diagnoses and subsequent treatment.
-
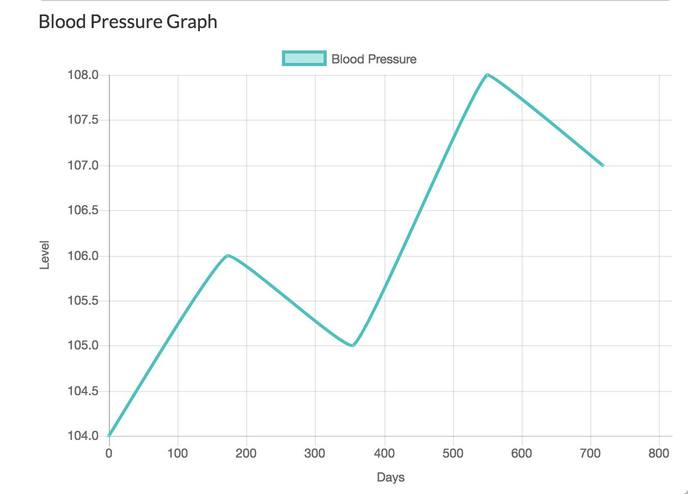
Patient Jason Wuman's blood pressure medical history.
-
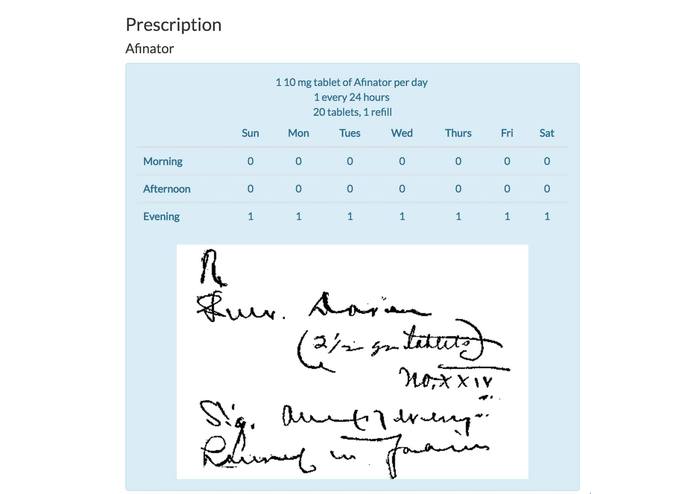
Patient Jason Wuman's prescription recommendation from his doctor.


Medical Visualization Report
Creating interactive and comprehensive patient medical reports through 3D visualizations.
Inspiration
The current exchange of health information between emergency medical services (EMS) and hospitals is difficult. In several surveys (EMSA 2013), agencies indicated that the they do not receive timely patient outcomes and discharge data as needed. Moreover, patients and their loved ones themselves are not hastily informed about their conditions, possible treatments, and affected bodily regions. We knew there was much progress to be made in both areas and chose to tackle improving the data visualization aspects.
What it accomplishes
Our project utilizes BodyParts3D ©, an open source 3D model of the human anatomy which includes the skeletal, muscular, cardiovascular, respiratory, nervous, and lymphatic systems. With this model, any patient is able to visualize the localized damage of their conditions and/or injuries. Moreover, we condensed, via tables and graphs, hospital records, prior medical records, and treatments to provide the patient with easily comprehensible information.
How we developed it
We used Blender to decimate the meshes of the model, allowing us to create significantly lower resolution meshes for convenient use on the internet. Then, we used HTML, CSS/Bootstrap, and WebGL/AngularJS/JavaScript to deliver a rich, interactive experience with the model in regards to the patient's conditions. Based on a doctor's notes, distinct anatomical regions in the model could be selected and focused on to further educate the patients and their loved ones on their conditions.
What we're excited about
We are ecstatic about how interactive the medical report ended up becoming. Data visualization via graphs and tables can only go so far to provide the viewer with information. We are very proud to have developed an instructional and responsive report. Not only will web-delivered medical reports make understanding health easier, but it will ensure ease of access and no need to memorize past afflictions.
The future
We believe that the field of interactive data visualization holds many promises and we look forward to see how easily information can be presented. We greatly appreciate your viewership of our project and hope that our work was inspirational.
Running the report visualizer locally
Simply start a local webserver in the repository's root directory, and navigate to http://localhost:{PORT}/index.html


Log in or sign up for Devpost to join the conversation.