-
-
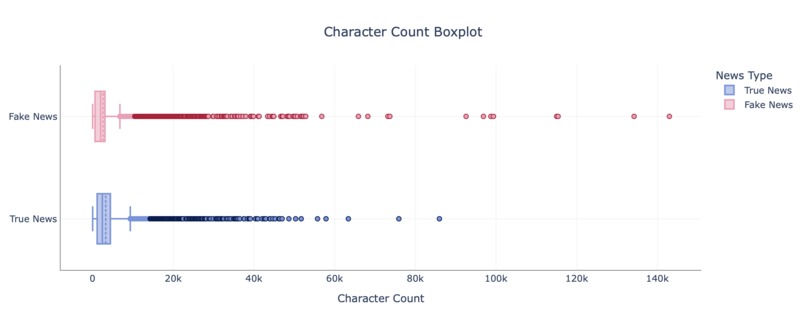
Fig1. Character Count
-
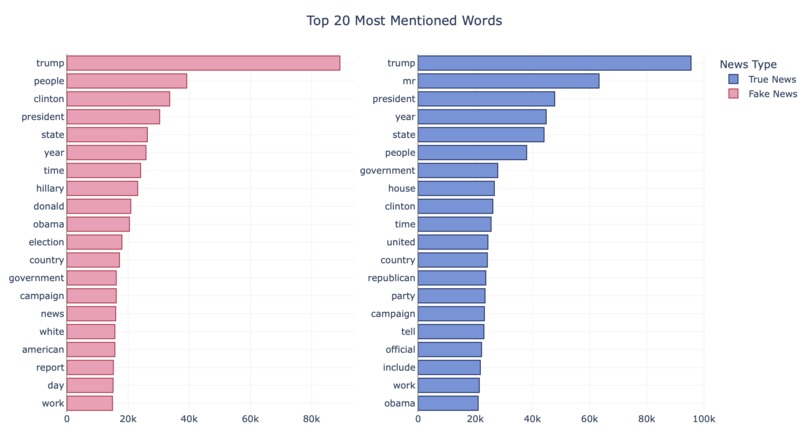
Fig2. Top 20 Most Mentioned Words
-
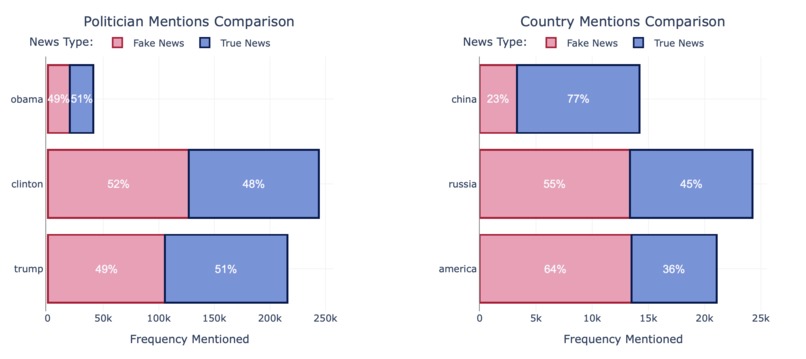
Fig3. Most Mentioned Politicians & Countries
-
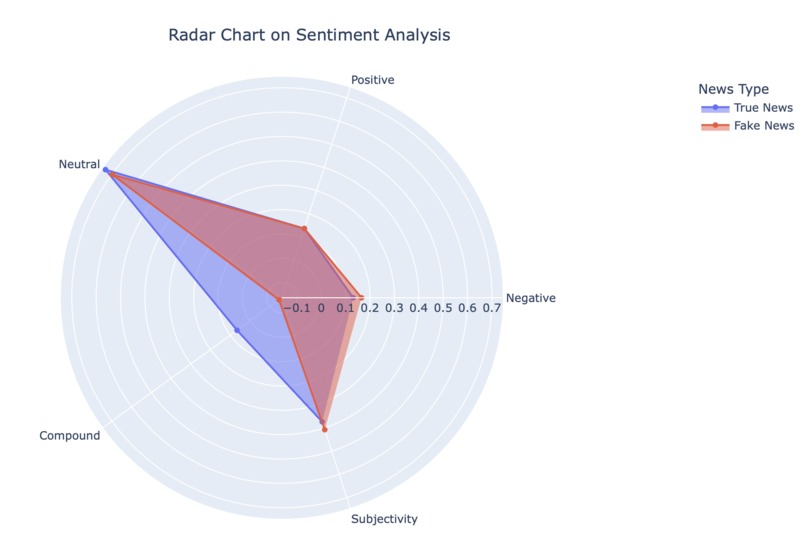
Fig4. Sentiment Analysis Radar Chart
-
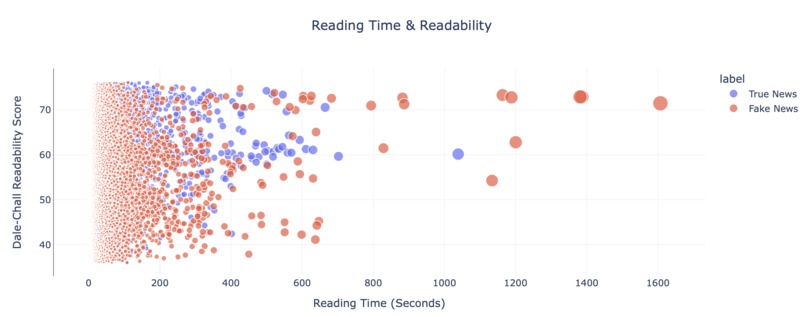
Fig 5. Readability Score vs. Reading Time
-
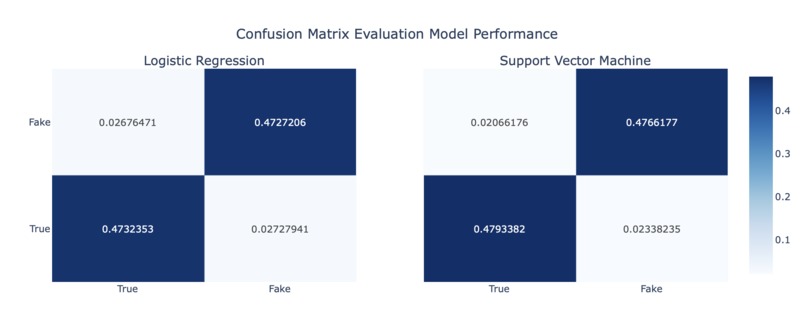
Fig 6. Confusion Matrix
-
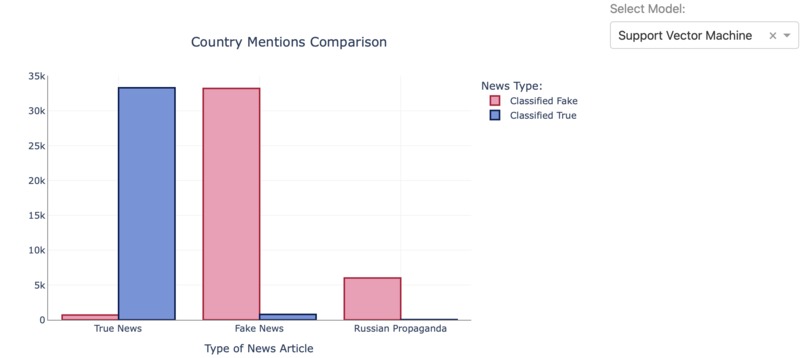
Fig 7. Russian Propaganda Evaluation using SVC
-
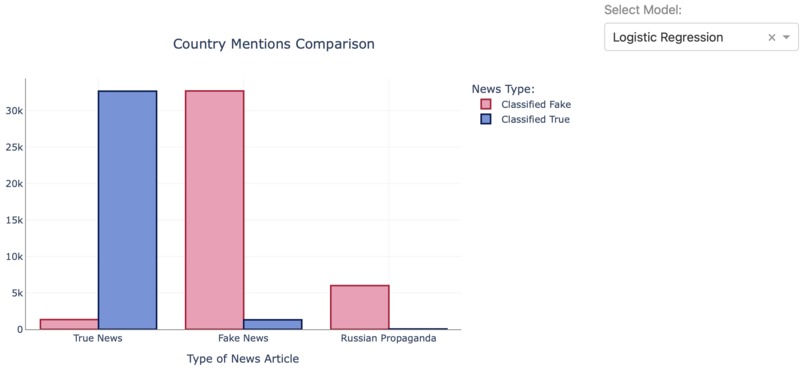
Fig 8. Russian Propaganda Evaluation using Logistic Regression
-
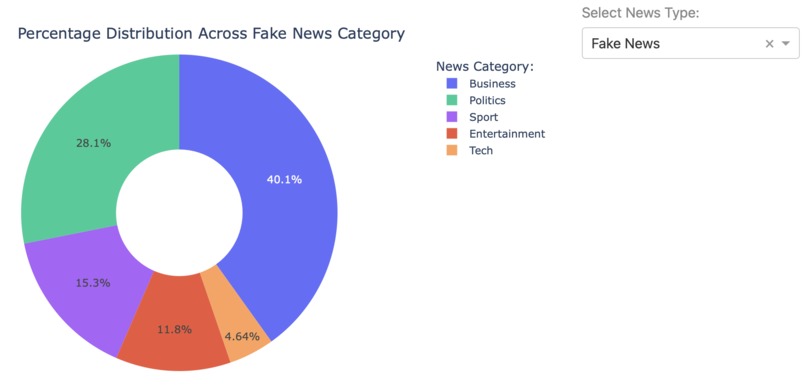
Fig 9. Categorizing Fake News
-
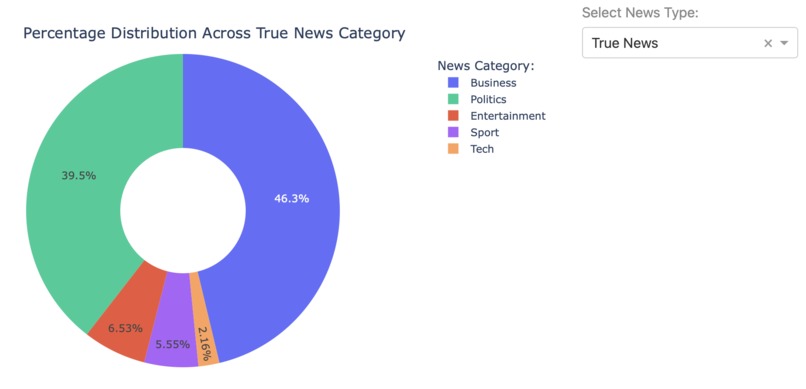
Fig 10. Categorizing True News


Misinformation Analysis Using Fake News Trends and Modelling
In this project, I looked into characteristics and trends of the True and Fake News articles. Classification models are built using the provided data to label Russian Propaganda dataset, and observe the proportion of Fake News labels in the dataset. Hence the terminology propaganda suggests, would the majority of the articles in the Russian Propaganda dataset be labelled as Fake News? I hope to derive an answer to the question through my analysis.
What it does
- Data Exploration & Analysis
- NLP Analysis
- Machine Learning Modelling for Fake News Detector
- News Article Categorization
How we built it
Visualizations are created using Plotly, exploratory analysis are done with Pandas and Numpy. Three machine learning classifiers are built using Scikit-Learn library: Logistic Regression, Support Vector Machine, Native Bayes. The interactive dashboard is made with Plotly Dash and deployed on Heroku.
Challenges we ran into
This was my first time creating a multi-page interactive dashboard. Although it was challenging, the experience was very rewarding as I was able to create a fully functional interactive dashboard at the end.
Accomplishments that we're proud of
As the CANIS Data Visualization hackathon didn't have predetermined themes, there was a large degree of freedom in terms of how to work with the given data. I enjoyed the data cleaning and preprocessing processes, trying different NLP techniques, and building models with high accuracy values. I am also proud to take further steps in categorizing the news articles.
What's next for Misinformation Analysis
Although not the most traditional approach, it would be interesting to filter data based on NLP scores (using NLTK and TextBlob libraries) prior to building a model. As we have seen in the news article categorization process, articles classified as Sports and Entertainments are more frequently seen in Fake News than True News. For such category, extra preprocessing steps can be done prior to building a model.

Log in or sign up for Devpost to join the conversation.