-
School districts in US Mainland
-


Inspiration
The challenge given to us this weekend was to analyze various socioeconomic and geographic factors in school enrollment, poverty level, and ability to obtain a mortgage. All four team members have previous experience with data science, but at varying scales.
How we built it
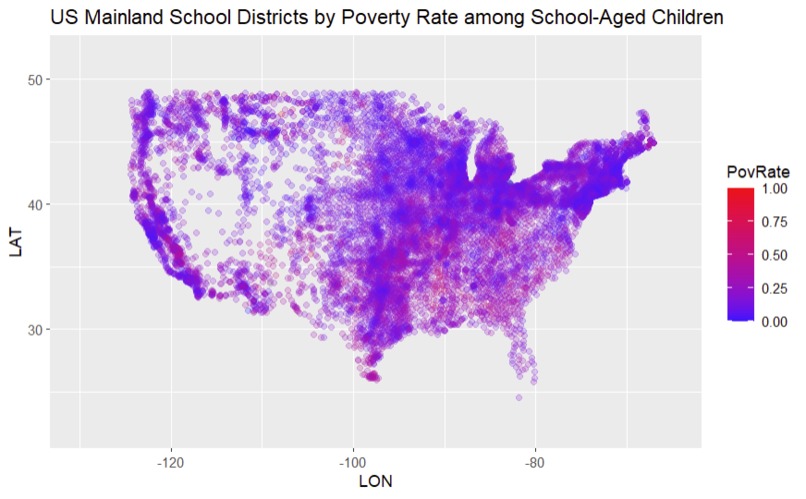
We explored the data set using Python, SQL, R, and Microsoft Excel. After carefully reading the data dictionaries and doing preliminary research, we compiled our information to a database and ran SQL queries to generate plots of poverty prevalence, rate of mortgage rejection, and proportion of students in poverty in a school district. The information is compiled using a combination of R presentation and a Streamlite frontend.
Challenges we ran into
There were many challenges. First, the data set was not cleaned, and we spent extensive time (more than previously thought) sifting through the data in SQL queries to ensure all data imported correctly. The use of ChatGPT running the GPT -4 model aided in creating the queries and optimizing the process.
Much of the data itself was unclear. Aside from formatting issues, several tables had to be joined to represent the information we need.
Accomplishments that we're proud of
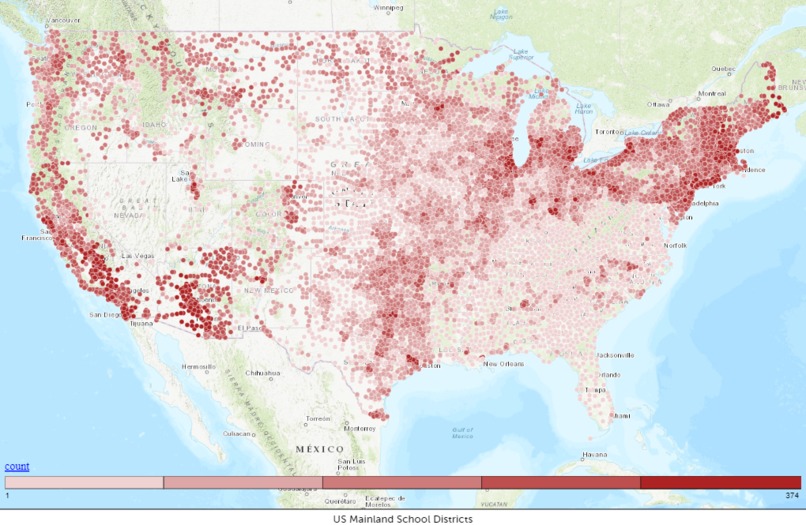
We are proud that we got preliminary maps showing the poverty data and location of school districts in the United States. We also were proud that we continued with the project, as we all wanted to give up in times of distress. All teammates learned new skills in interfacing data and programming languages, as well as ways to represent them.
What we learned
Cleaning big data is extremely difficult. Without optimizing SQL queries, memory, and disk space, some of these tasks are impossible. It is up to the analyst to plan how to separate the tasks, as in some time-sensitive environments, poor searches can take much longer than expected. With the release of ChatGPT, we all learned how to leverage it to prompt for code and verify that it indeed does the job we need. This was boosted with the use of the paid GPT-4 model, which allowed for more creative tasks. Finally, the creation of heat maps with geographic data and linked tables was an outstanding accomplishment.
What's next for Mixed-Experience Developments
We would like to also examine the interest rates of mortgages obtained in each area, separated by race. This would answer the question that every person is given a fair chance to obtain a home loan. We would also like to see the distribution of loan amounts given by geographic area and by race.
Built With
- chatgpt-4
- dbeaver
- postgresql
- python
- r
- sql
- streamlite

Log in or sign up for Devpost to join the conversation.