-
-
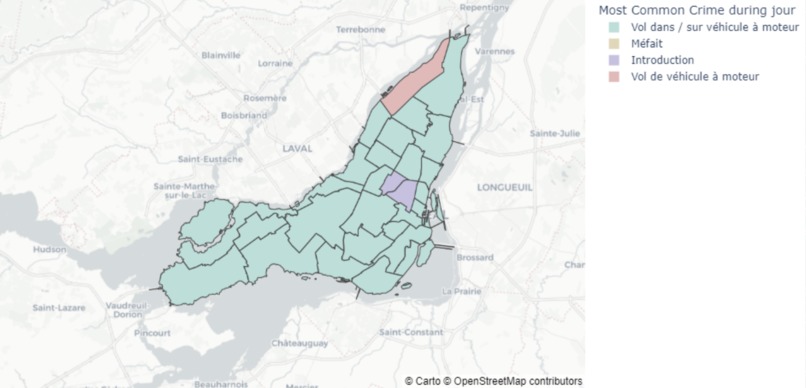
Most common crime during jour
-
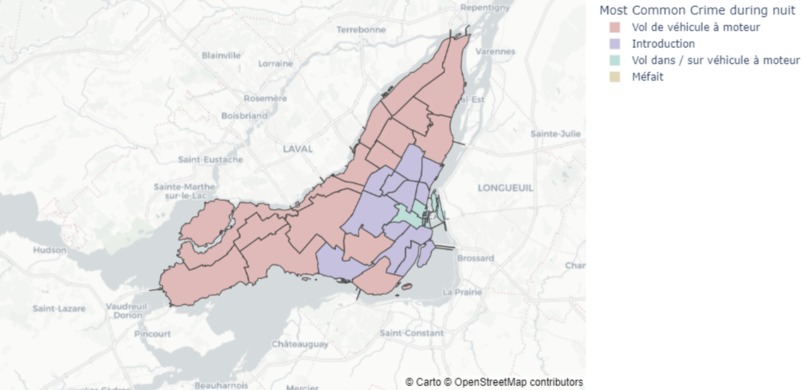
Most common crime during nuit
-
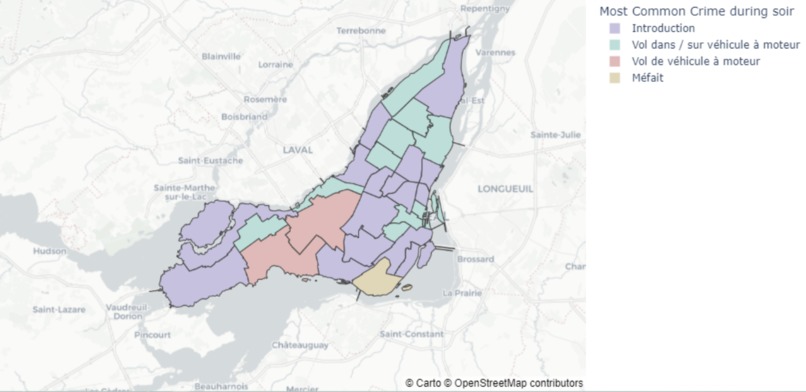
Most common crime during soir
-
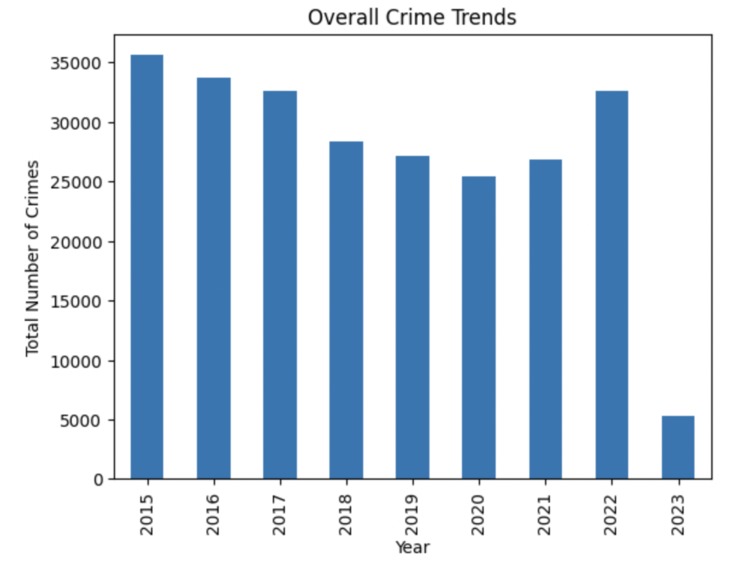
Over crime trends


Inspiration
We were provided Montreal crime data from 2016-2023 and wondered what caused the differences in the numbers between times of the day, types of crime, which police district of quebec, and over the years.
What it does
We identified the most common crimes throughout the day and visualized them on maps. We also display on a bar graph how the number of crimes changed over the years.
How we built it
We used jupyter notebooks and libraries like pandas and matplotlib.
Challenges we ran into
We had technical difficulties with the installation of required libraries and applications.
Accomplishments that we're proud of
Even though we didn't have much experience with data projects before, we were able to figure things out and make nice visualizations that made the data more easy to understand.
What we learned
We learned more about how to explore data sets and visualize them in effective ways.
What's next for Montreal Crimes
We want to enrich the dataset with census data (such as income and population) and explore any correlations there.

Log in or sign up for Devpost to join the conversation.