-
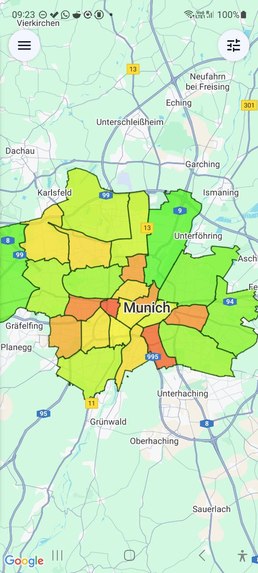
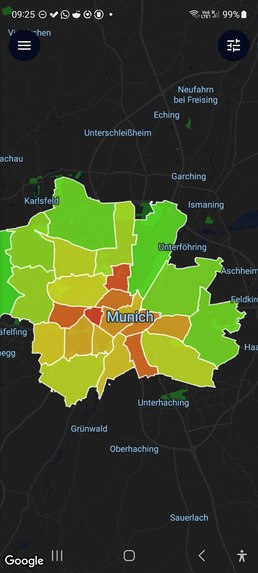
Main Screen (Map)
-
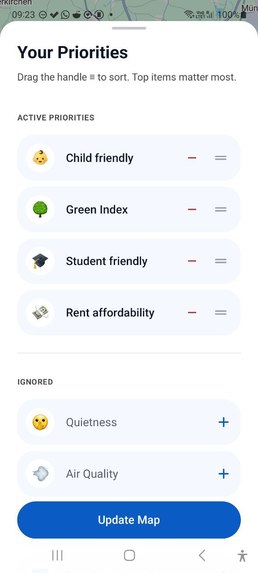
Priority Settings
-
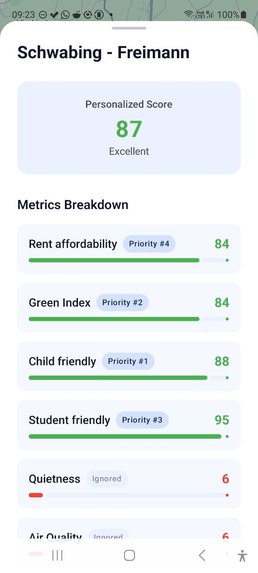
Districts Information
-
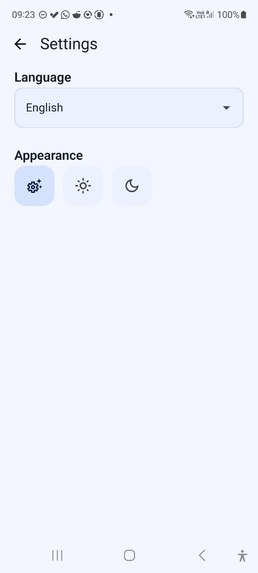
Settings
-
Dark Mode


🏙️ Muniq — Find Your Place in Munich, Powered by Data
🎯 Inspiration
Finding a home in Munich is stressful, and most housing platforms only show basic details like price and square meters. They don’t answer deeper questions:
- How quiet is this area?
- How green is it?
- Is it family-friendly or student-heavy?
- How good is public transport here?
- What’s the air quality like?
Munich already offers high-quality open data, but it’s scattered and hard to use.
Muniq makes this data intuitive, visual, and personal.
📱 What Muniq Does
🌈 Interactive Heatmap
Districts are color-coded from green → red based on how well they match the user’s priorities.
🔧 Drag & Drop Priorities
Users can reorder what matters most:
- Quietness
- Green space
- Public transport
- Bike infrastructure
- Rent affordability
- Air quality
- Family-friendliness
The heatmap updates instantly.
🔍 District Insights
Each district includes:
- Fit score
- Environmental metrics
- Mobility metrics
- Rent & density trends
- A concise description
- Optional overlays (noise, bike lanes, PT stops)
🧭 Cross-Platform App
Built using Compose Multiplatform, Muniq runs on:
- Android
- iOS
- Web (WASM)
with native Google Maps on each platform.
🛠️ How We Built It
📱 Frontend — Kotlin Multiplatform
Key technologies:
- Kotlin Multiplatform (shared logic + models)
- Compose Multiplatform (shared UI)
- Google Maps SDK (wrapped with expect/actual)
- Koin for dependency injection
- Ktor for networking
- Material 3 design system
- Localization (EN/DE/RU)
- Light/Dark mode
UI features:
- Safe-area aware floating buttons
- Animated sidebar
- Priority editor with drag-and-drop
- Bottom sheet (peek → half → full)
- Clean, minimal design
🔧 Backend — Kotlin + Spring Boot + Firestore
Backend code lives in muniq/backend/.
Technologies used:
- Kotlin 2 + Spring Boot 3
- Spring Web (REST)
- Kotlinx Serialization
- Firestore (Firebase Admin SDK)
- Docker
- Google Cloud Run
Backend Layout
- Model:
GreenRating.kt - Repository:
GreenRatingRepository.kt - Service:
GreenRatingService.kt - Controller:
GreenRatingController.kt
API Endpoints
GET /api/green-ratings GET /api/green-ratings/{id}
Why Firestore?
- Easy to work with district-level documents
- Automatically scalable
- Fast to iterate on
🧮 Data Pipeline
Data scripts live in muniq/scripts/.
Sources
We use official Munich datasets:
- Noise
- Air quality
- Bike lanes
- Public transport
- Green spaces
- Rent
- Childcare
- Population density
Steps
- Raw datasets → district metrics
- Normalize all metrics to a 0–100 scale
- Merge into district vectors
- Upload to Firestore
☁️ Deployment — Google Cloud Platform
- Cloud Run for hosting (autoscaling + HTTPS)
- Artifact Registry for container images
- Firestore for data
- Secret Manager for config
- GitHub Actions for CI/CD
🧗 Challenges
- Integrating Google Maps on iOS using a Compose wrapper
- Handling drag-and-drop in a draggable bottom sheet
- Normalizing datasets with completely different scales
- Managing shared fonts/resources across platforms
- Consistent safe-area handling (notches, bars, islands)
🏆 Accomplishments
- Fully working cross-platform app
- Real-time map scoring
- Clean backend + data pipeline
- WASM version running in browser
- Architecture ready for other cities
- Polished UI matching our design spec
📚 What We Learned
- Compose Multiplatform is production-ready
- Native map interoperability works well
- Open data becomes powerful when visualized correctly
- Firestore is a great fit for flexible geographic data
- Shared Kotlin code accelerates development significantly
🚀 What’s Next
Apartment Listings
Connect district results with real housing listings.
More Cities
Architecture scales naturally to:
- Berlin
- Vienna
- Zurich
- Hamburg
Community "Vibe" Scores
Crowdsourced insights about nightlife, coffee, walkability, safety.
AI-Powered Recommendations
Automatically suggest districts based on user behavior.
🎉 Final Thoughts
Muniq transforms open city data into a simple, personal tool for discovering where in Munich you’d feel most at home.
It’s not just "Where can I rent?"
It’s "Which part of the city fits me?"
Built With
- gcp
- kmp
- kotlin
- spring

Log in or sign up for Devpost to join the conversation.