


Inspiration
Many systems in Air Traffic Control towers are outdated, and the industry is facing a shortage of qualified controllers while close-call incidents continue to rise. This mix of aging technology, fewer staff, and higher risks creates major pressure on those responsible for keeping flights safe.
We created Navda to support and improve existing systems. It gives controllers a clearer situational context, helps them make faster and more confident decisions, and reduces their workload and stress, leading to safer and more efficient operations in the tower.
What it does
Navda has many different interactive features for Air Traffic Controllers, including 2D and 3D maps to better visualize the positions of planes in the vicinity of a selected airport.
Navda also has a feature that digitizes the flight information paper strip system on an airport frequency system completely. Navda is ready to take in FAA ERAM data for airports to use to track the progress of departing planes. The Navda flight strip system can be used manually, like legacy systems, or also automatically updated using ATC voice commands.
Navda has a watchlist feature for ATC, in which ATC can keep track of specific flights and receive different alerts.
How we built it
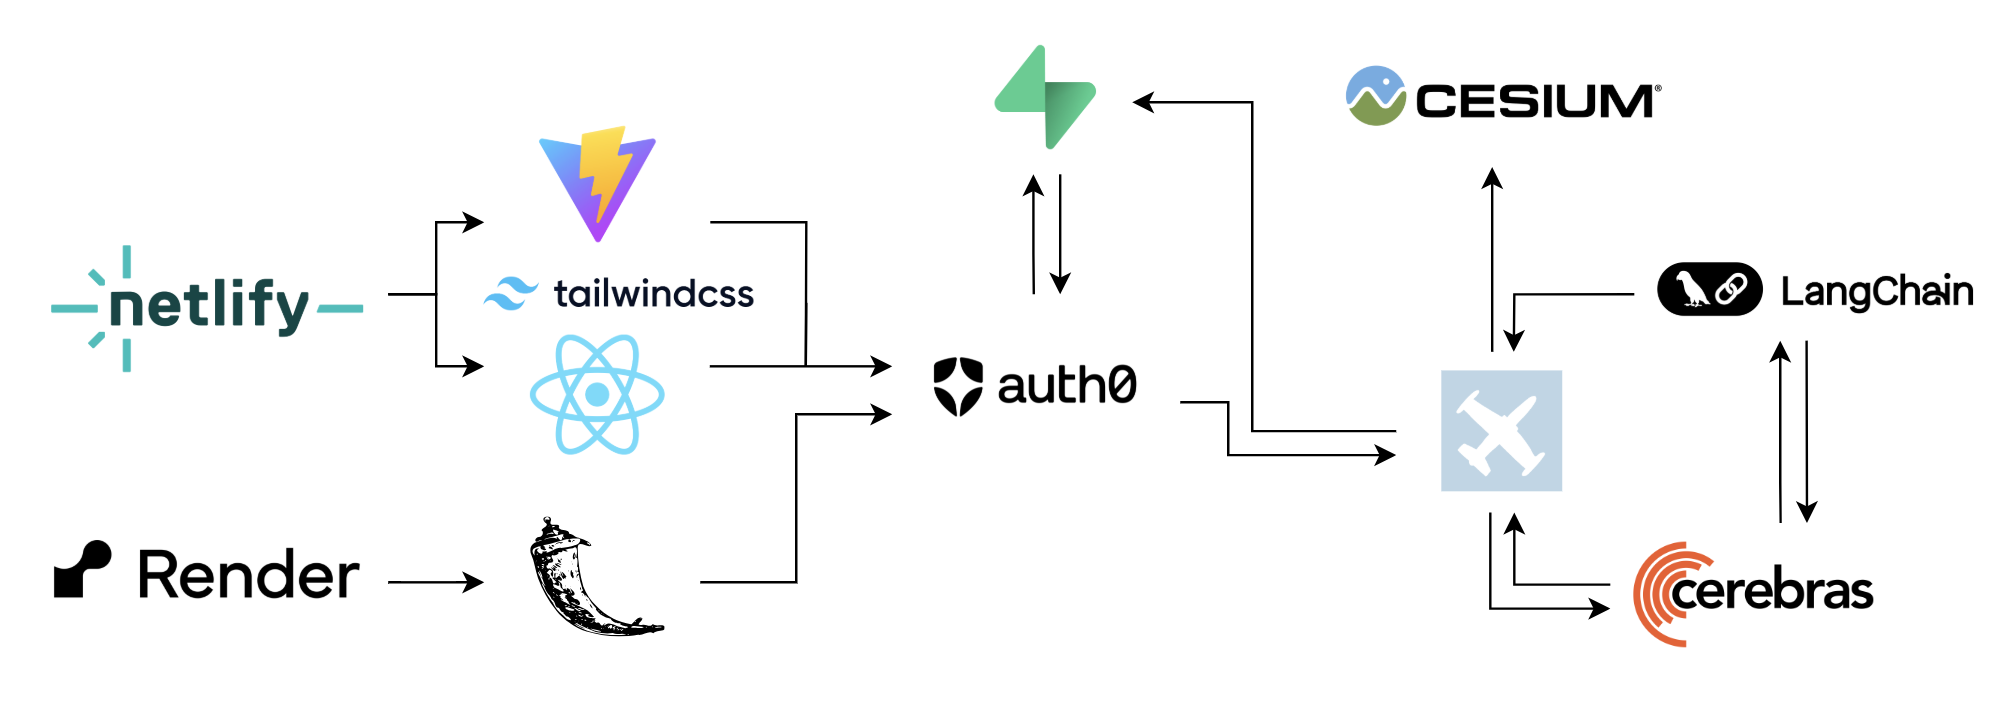
We started the project as a basic React + Flask project. From there, we started thinking about how we can effectively visualize aircraft data and supplement the current flight progress strip management system. 3D visualizers aren't as widespread due to their complexity and lack of support, and we decided to take a stab at visualizing the data points in 3D space. Using Cesium JS and adsb.lol for 3D geospatial visualization and live data, we were able to view planes at different altitudes and see them update their position in real time!
Redefining the flight strip system was the biggest feature that we tried to target in our development process. Why should air traffic controllers use paper strips, legacy software, and drag-and-drop logic when NLP and Speech-to-Text features exist? We utilized Cerebras AI to field match quickly and execute actions to move flight strips and represent aircraft status accurately. With Google's Speech-to-Text API and Cerebras, we use speech to automate the flight strip tracking process, saving crucial time.
We continued to use Cerebras with Langchain to process aircraft data that is marked as important by an air traffic controller. Using this, we can investigate the details of aircraft as well as execute actions all in one editor.
At the end, we deployed the application using Netlify (frontend), Render (backend), and Supabase as the data storage.
Challenges we ran into
We ran into many hiccups during the development process. One of the most significant issues that we had was with rendering the 3D map with Cesium and finding flight data information to map. A lot of the challenges that we ran into were mostly solved by researching the technology more.
Besides the actual application, researching the problem with legacy systems in the tower was quite an endeavor. A lot of the information that we were able to find on flight strips specifically was done through hours of research on how they were used, when they are passed around, etc. The FAA is a government entity, and as with many different government entities, the information and data that we wanted to use in our application are unfortunately not available for public use. Therefore, we had to develop our application around the idea that data from the government (specifically flight strip data from the FAA ERAM) could be easily implemented into the application in the near future.
Accomplishments that we're proud of
As a team, we definitely had the challenge of working with new technologies that we weren't really familiar with at all. There were many frustrating times throughout the development of this application, but reflecting on the last couple of hours, the frustrating times were worth the satisfaction when we finally got a specific part of the application to work. Specifically, one of the problems that we had was with the rendering of the 3D maps and the flights showing up on the maps. We struggled with trying to figure out Cesium while also finding data for flight tracking. Using Cesium was arguably one of the biggest issues we had, but we eventually figured it out.
Another accomplishment that our team is proud of is learning what ATCs do behind the scenes. It was such an eye-opener to see how complex systems and communications are in the tower. It's a spill of knowledge that not many people will get to see, and our team is glad to have researched deep into this topic, and hopefully make a change to those ATC systems in the future.
What we learned
Across these 36 hours, we learned a lot about WebAR and 3D data visualizations. Working with flight data was more complex because of the 3D position data and numerous aircraft attributes. Utilizing Cerebras as a low-latency assistant also posed some challenges, where we had to format input data carefully to prevent inaccuracies in field matching. Besides improving technical skills, we got some awesome feedback from the Cerebras team and other competitors that helped us refine our vision and showed us how important idea validation is.
What's next for Navda
Many of the hurdles across the duration of the hackathon came with the FAA not being able to disclose information that could have been of great use to Navda. Gathering information and data from the FAA ERAM would be a significant step in the right direction for Navda. Navda is all about optimizing ATC efficiency, and so another step for Navda in the future would be to create even more tools that supplement, or even replace, a legacy system in the tower.
Built With
- auth0
- cerebras
- cesium
- flask
- javascript
- langchain
- netlify
- python
- react
- render
- supabase
- tailwindcss
- vite


Log in or sign up for Devpost to join the conversation.