-
-
-
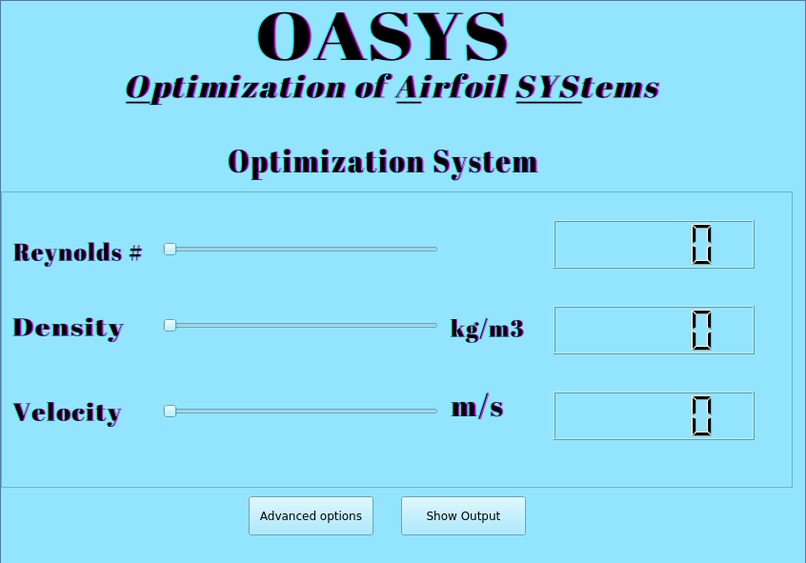
Main Page
-
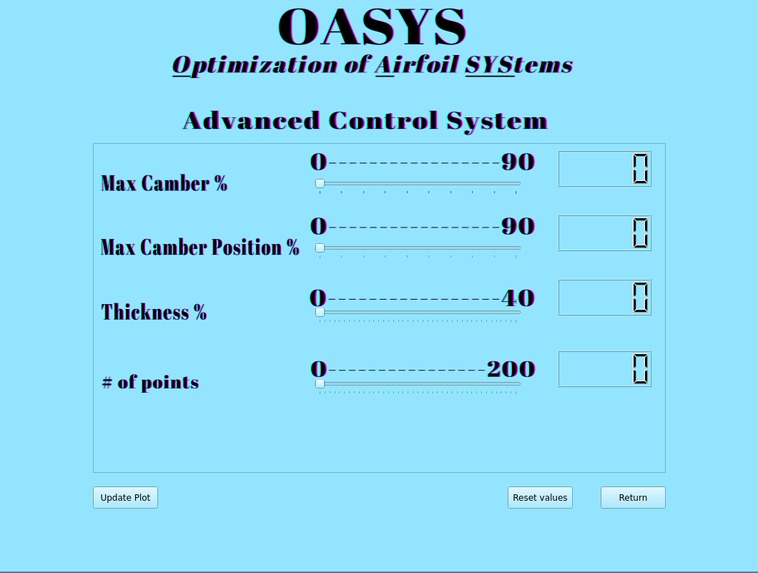
Airfoil Customization Page
-
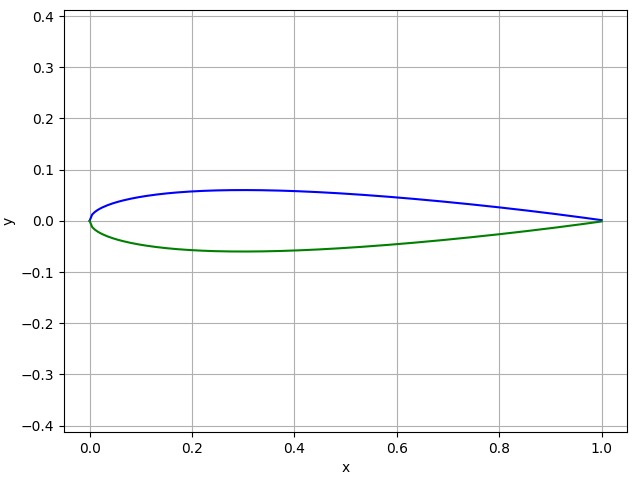
Customized Airfoil
-
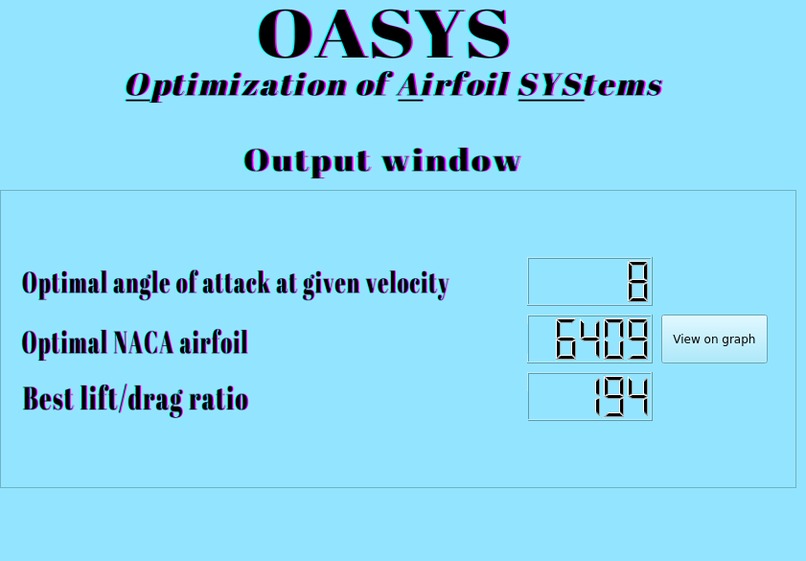
Optimized Airfoil
-
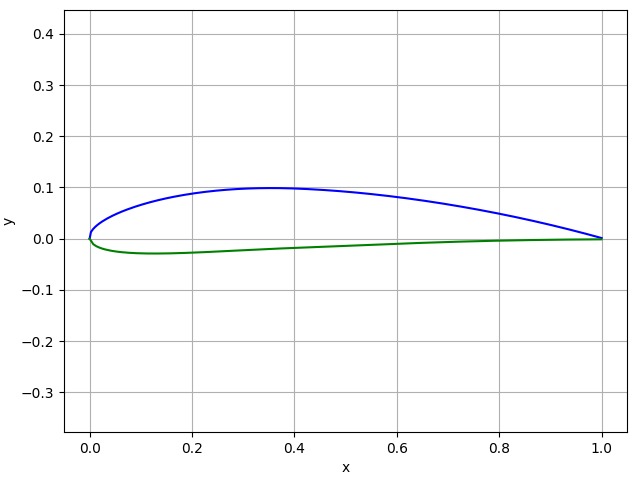
Optimized Airfoil


Inspiration
We were inspired by the nature of aviation and how tiny details of the wing impacted the flight.
What it does
The project takes
How we built it
User can adjust the Max Camber %, Max Camber Position %, Thickness, and the scale of the graph, which produces an airfoil plot with optimal stats.
Challenges we ran into
The project was very math based and required a lot of research and calculations. In addition, the code was sometimes buggy or did not run.
Accomplishments that we're proud of
We are proud of configuring the GUI and our presentation.
What we learned
We learned how to use new programs, time management, and improved our researching skills.
What's next for OASYS
We will continue to improve the accuracy of our suggested data to the user and optimize the plot for maximum precision.
Built With
- pyqt5
- python
- xfoil


Log in or sign up for Devpost to join the conversation.