-
-
Landing page | Plant Here!
-
Analysis Results | Plant Here!


Inspiration
Thousands of years ago, humans learned how to farm and formed small agricultural communities that would eventually become the complex networks of farms, food processors, and vendors that feed the world today. But humans then had no technology to assist them besides simple tools and knowledge of common patterns (such as the right weather and soil). Today we have fast internet, machine learning algorithms, and satellite technology that helps us make those decisions! We wanted to employ some of these incredible innovations to build our own service that helps farmers make the most of their land by planting the most suitable crops possible, thus contributing to the UN Sustainable Development Goals of zero hunger and climate action.
Specifically, we would like to help farmers in Africa find the best times and locations to plant their crops. Jake's uncle is a farmer in South Africa and shared with us the difficulties of finding the best crops to grow in his area. Many natural factors that affect plant growth are out of his control, notably the soil PH and the rainfall.
Because of unpredictable weather and variable soil quality, many farmers plant at the wrong times, leading to excess usage of water and spoilage of crops. As a result, his uncle says that "Africa is one of the leading countries in unsustainable agriculture."
What It Does
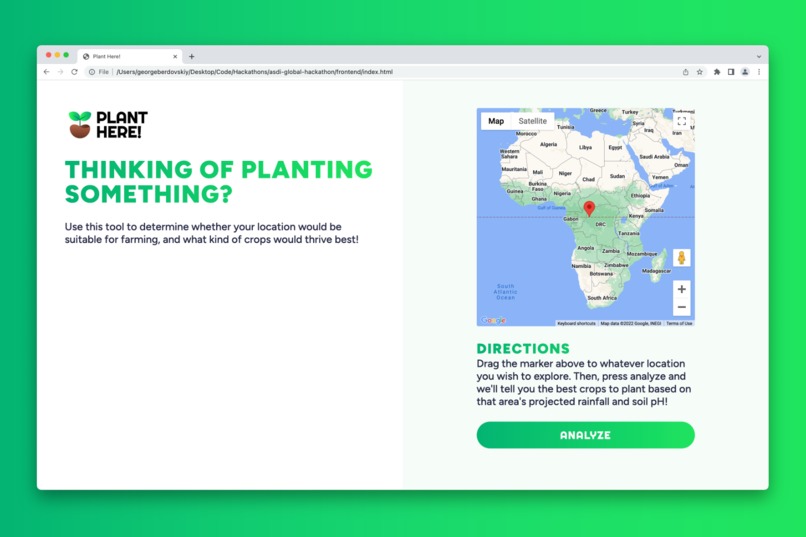
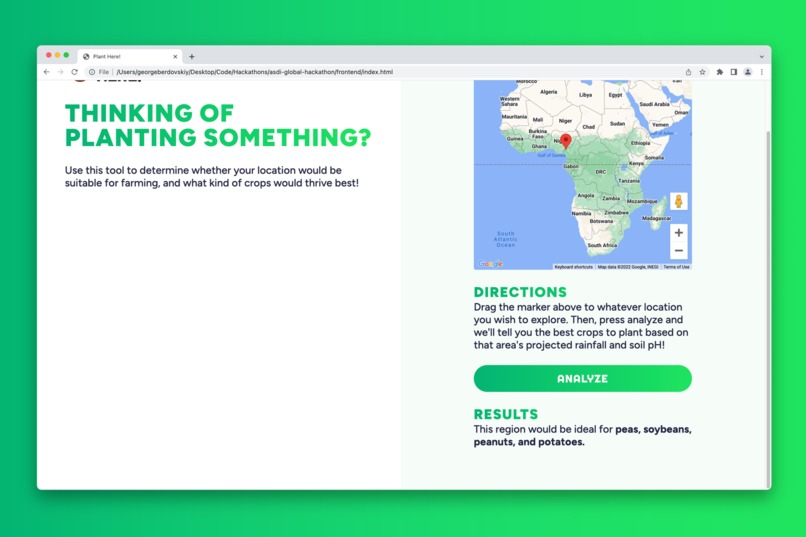
Users interact with an embedded map, where they can drag a marker to any location they wish to plant something (unfortunately, we had to limit the analysis to the African continent due to technical and data limitations). When they press analzye, the application will send the requested coordinates to the backend server, which will determine the estimated rainfall for some time period in the future and return the crops that would be most suitable for that rainfall and pH.
How We Built It
We began by holding team discussions, during which we talked about what the goals of the project would be, what kind of AWS Data Exchange resource we would use, and what technologies we would employ. Then, we each developed separate aspects of the application (frontend, backend, data download, and analysis) and came together to finish the project!
The frontend takes advantage of the Google Maps API to find the user's location (or any location they want to test) without manually entering coordinates. The webpage is built with HTML/CSS, Vanilla JS, and Petite Vue (a 6 kB subset of VueJS). When the button is pressed, a JSON object containing coordinates and the timeframe is sent to the backend, which collects the relevant data about rainfall and soil acidity. Finally, the server matches the results with our own database of crop data to return crops fulfilling rain and soil requirements to the user.
Challenges We Ran Into
One of the more significant challenges we faced was data processing. This was our first time using AWS, and it was very exciting to learn more about it through such a hands-on experience! The instantaneous rainfall estimation data provided by NOAA was very large and spread across hundreds of files stored in an AWS S3 bucket, so we first had to download that data and condense it into a smaller format with an automated Python script. The soil data was also spread over several files, so it needed to be processed, combined with other data, and exported in a more convenient format before analysis as well. This took the majority of our time.
Communication was also a small challenge because our team was international in every sense of the word! Although coordinating meetings over three different time zones was tricky, we persisted and completed this project.
Accomplishments That We're Proud Of
We're very proud of building this project in such a short amount of time and the many new technologies we learned during the experience.
More specifically, the way...
- Jake, our backend expert, used concurrency to decrease the file download time,
- George, our data analyst and frontend developer, creatively reduced the quantity of our data by removing zero values from the downloaded files and normalizing the rate measurements over each day,
- And the way Terry, our team coordinator, glued the frontend and backend together to produce a working product
What We Learned
We learned more about...
- AWS (specifically S3 and Lambda), how it works and why it's important
- Analysis of large and varied datasets
- Backend (FastAPI) and frontend (Petite Vue) development
What's Next for Plant Here!
In the future, we hope to improve the rainfall prediction for Plant Here by processing rainfall data for more than just one year with a better statistical model.


Log in or sign up for Devpost to join the conversation.