-
-
-
Title Slide
-
-
-
-
-
-
-
-


Inspiration
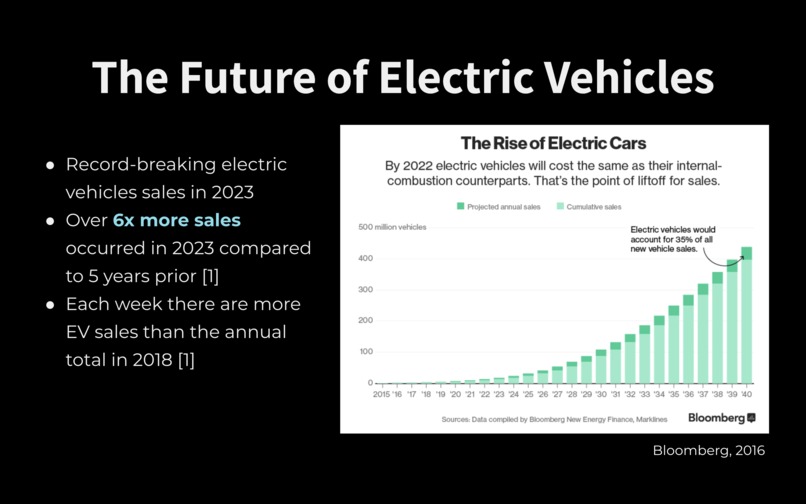
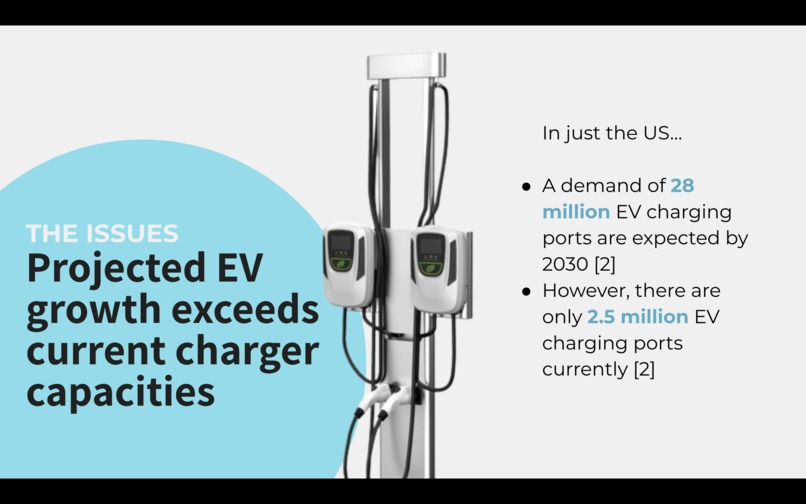
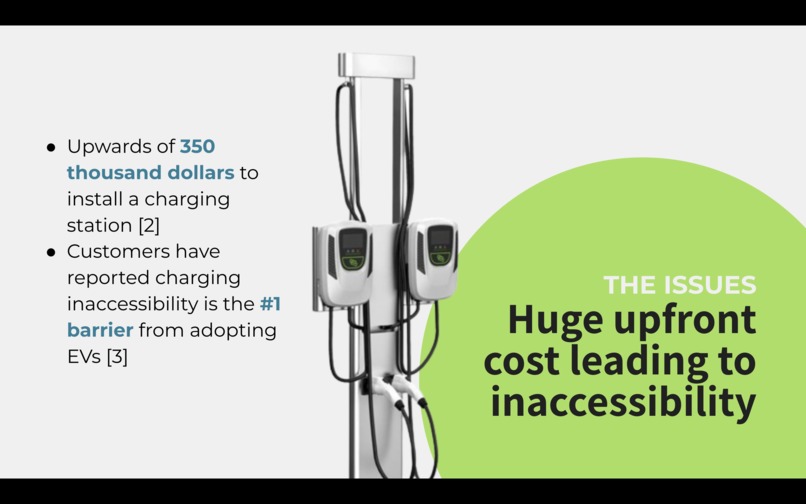
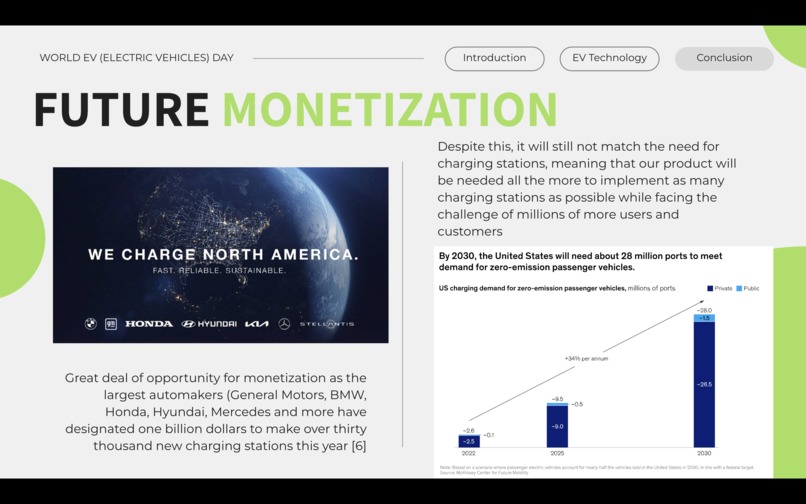
With a record breaking number of sales of electrical vehicles (EVs) in 2023, it is clear that the demand and projected growth of EVs far exceeds current charger capacities. In fact, according to McKinsey & Company, just in the USA, a demand of 28 million EV charging ports are expected by 2030. However, there are only 2.5 million charging ports currently. These lack of chargers and costly at-home installation costs steer many new car buyers away from the EV market. It goes without saying that this will be detrimental for the environment in the long term. For this reason, we propose PowerMap, a tool to model the vehicle flow in cities and mathematically optimize the best locations for putting EV chargers.
What it does
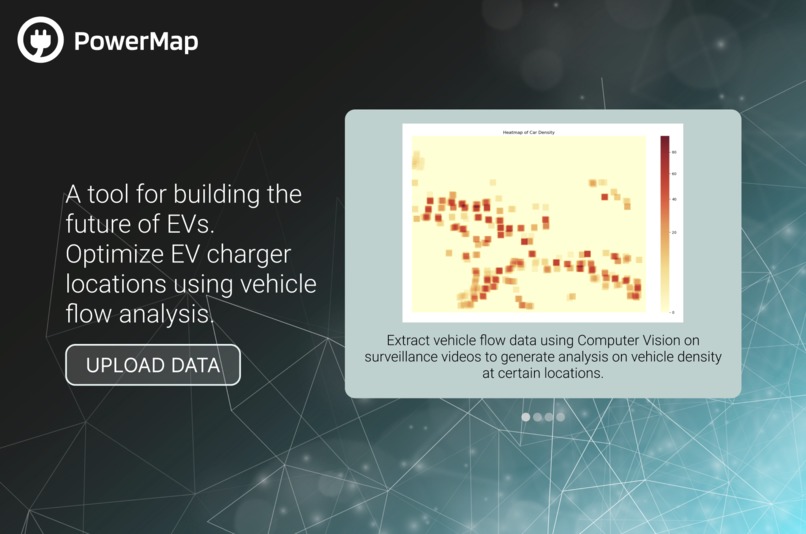
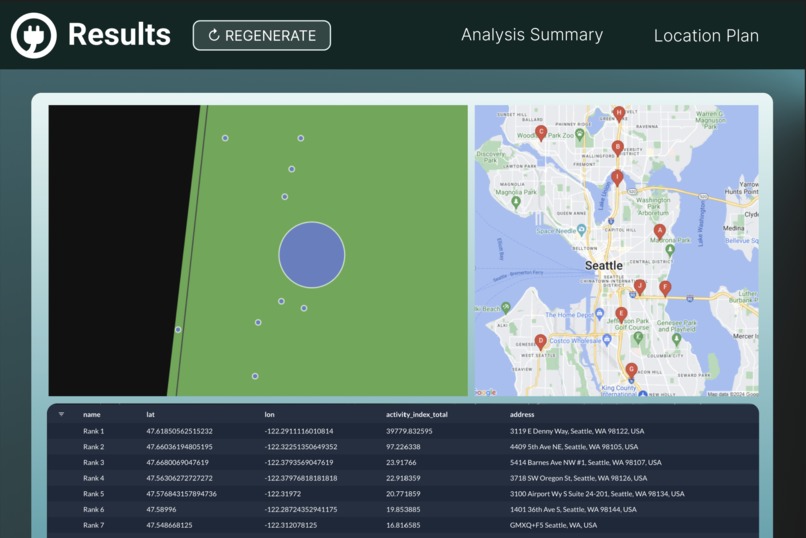
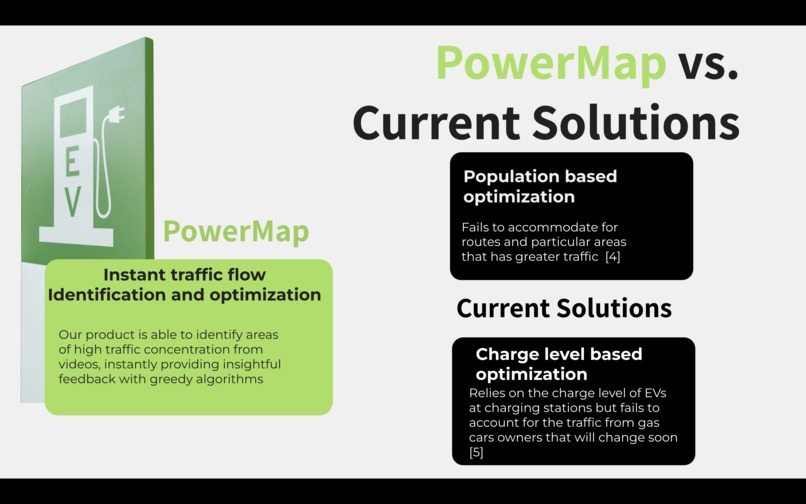
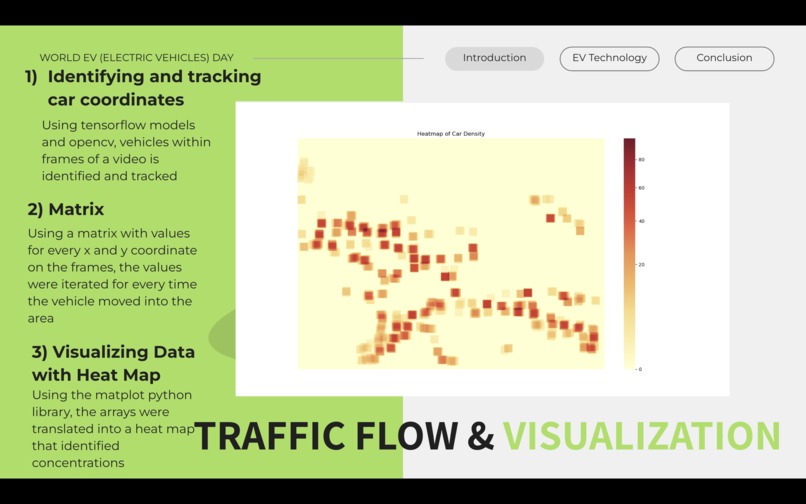
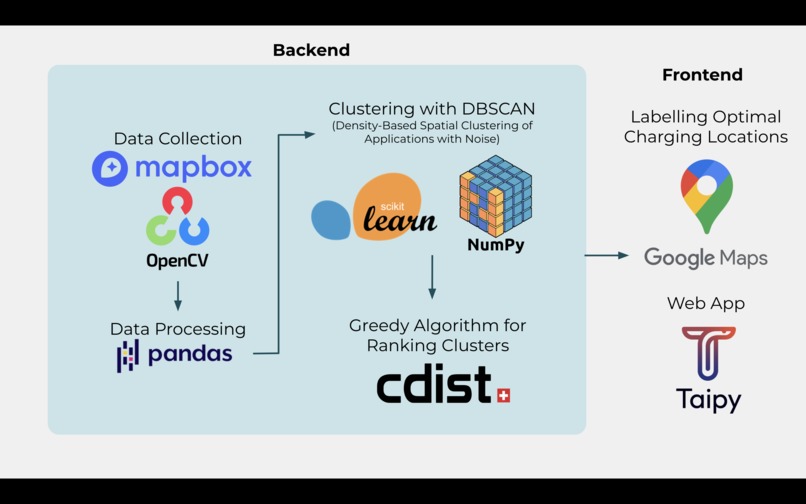
PowerMap serves as a tool for collecting vehicle data and using it to determine the best locations in a city to place the chargers. Data collection is done using OpenCV powered by a TensorFlow car detection model. From there, we can create heat maps to show the densities of cars at certain points. Using DBSCAN (Density-based spatial clustering of applications with noise) powered by NumPy and Sci-kit, we can identify clusters with high vehicle activity. Then, we can use a greedy selection algorithm for ranking these clusters. To make this tool easy to use, we integrate Taipy and Google Maps for effective data visualization in the form of heat maps, geographical maps, and tables.
How we built it
We built PowerMap using computer vision tools such as OpenCV alongside other machine learning tools such as TensorFlow, NumPy, and Sci-kit. Test data was obtained from MapBox to aid in the development of the clustering algorithm. We leveraged the Google Maps API to create easy-to-view insights from the data pipeline. Lastly, we enclosed everything in a Taipy web application which offers many data visualization tools.
Challenges we ran into
The greatest challenge we faced was the disparity in language support for different frameworks. We initially went with a Next Typescript frontend, but soon realized that this would be inefficient as the stronger data visualization components and functions were better supported in Python. Thus, we used an obscure, but useful frontend library named Taipy to create the web application. Another huge difficulty was creating an evaluation framework to actually know if our clustering and ranking pipeline was accurate. We had to find real world data on charging stations and write test functions to compare them to our generated results.
Accomplishments that we're proud of
We are proud of the fact that we were able to apply linear algebra knowledge from school into a real-world problem. It was also interesting to explore Python frameworks that make data manipulation very beginner-friendly.
What we learned
We learned about many new frameworks to work with data that we can all carry into our education going forward. Our team consists of a computer science student, biomedical engineering student, and civil engineering student, and this project gave us all tools that we can apply to our respective fields.
What's next for PowerMap
We plan to work on developing the accuracy of our clustering algorithms and hopefully improve our data collection processes.
Slides: https://docs.google.com/presentation/d/1mD2TdGSPJM5PfEsmoDiNcbvFF1qBVocEH0cbytS_RrM/edit?usp=sharing

Log in or sign up for Devpost to join the conversation.