-
Result from map
-
Map picture 2
-
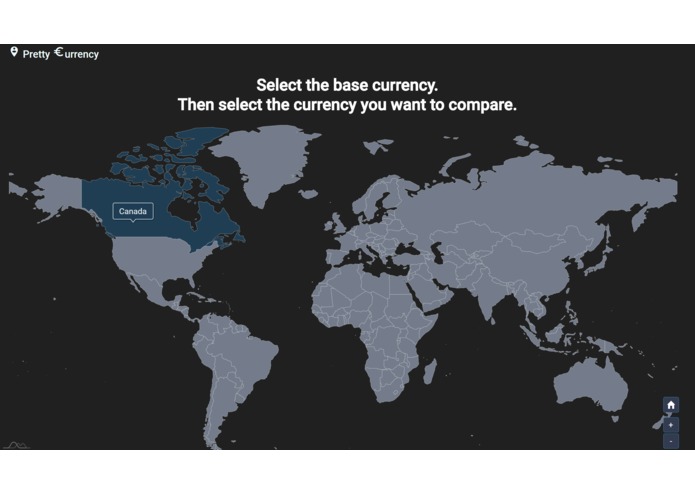
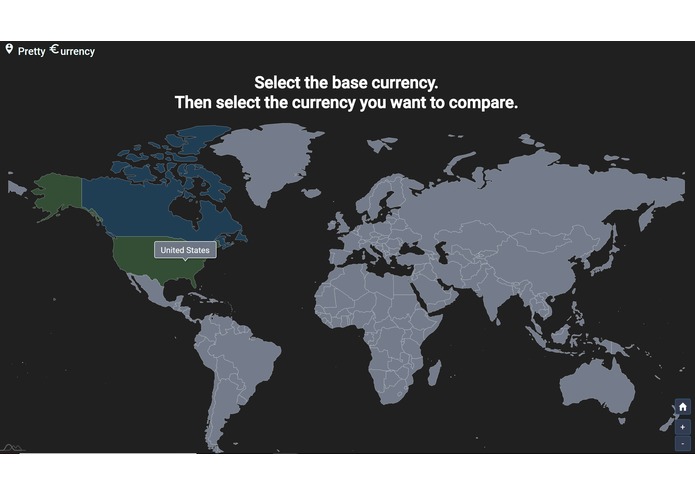
Map picture 1
-
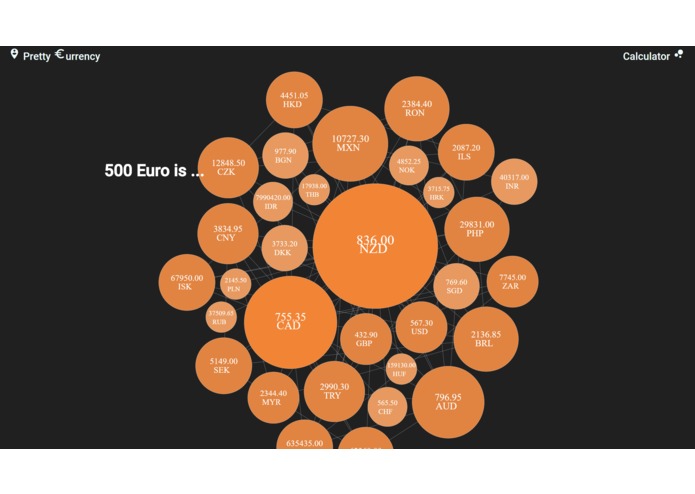
Node picture


Inspiration
Data visualization is one of the most important factors for business and technologies. It allows them to share information and present the processed data. Therefore, we are aiming for users who want to facilitate data visualization with various types of results.
What it does
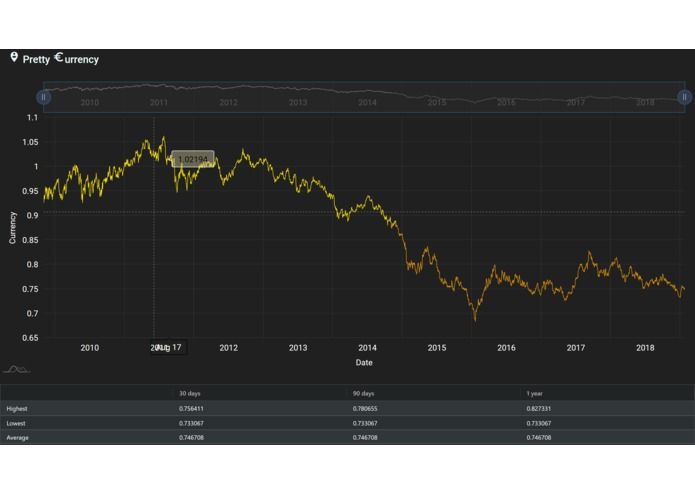
Pretty Currency can visualize the data. For this project, we aimed to visualize currency exchange rates with beautiful visualizations. It shows 34 foreign currency rates. The user can select the country on the map and based on this selection, the output data will be visualized.
How we built it
We retrieve data from open data API and we use Angular for the front-end. For visualization, we used various libraries such as d3.js, AmCharts, and Angular Material. To achieve a user-friendly design, we have implemented an interactive map from which the user is able to select the base currency and exchange currency. All the logic is done in Typescript which, when compiled, converts to Javascript. In terms of deployment, we used firebase and we got a free domain from .TECH.
Challenges we ran into
Firstly, it was challenging to find a proper dataset to visualize, so it took some time to figure out the appropriate inputs. Also, it was the first time we used data visualization libraries so we had a lot to learn in a short amount of time.
Accomplishments that we're proud of
We are proud of how our project turned out and that we have made a web-page which is accessible to the public. it was a great chance for us to implement what we have learned through our experiences during internships and school.
What we learned
We have learned a lot of front-end web development skills and new materials, especially for data visualization libraries. Two members of our team were participating in their first hackathon, so they learned what it is like to collaborate in a team in a high-pressure environment.
What's next for Pretty Currency
- We would like that our web app could be used not only used for exchange rates, but also an extension to other topics such as the stock market, cryptocurrency market, and anything that can be compared.
- Implement more types of data visualization.
- Export with PDF, CSV, JSON etc.. / import dataset using with this application.
- Train data to predict general anticipation of future graphs.
Built With
- amchart
- angular-material
- angular.js
- d3.js
- typescript
Log in or sign up for Devpost to join the conversation.