-
-
Divergence Gauge
-
Dashboard
-
CONFLICT MAP


Inspiration
In an era of AI-generated content, media echo chambers, and information overload, it's increasingly difficult to separate signal from noise. We asked ourselves: when public sentiment drifts from reality, how can we detect it?
The answer came from an unlikely source — prediction markets. Unlike pundits and headlines, bettors put real money on outcomes. They have skin in the game. When journalists say one thing but bettors do another, someone is wrong.
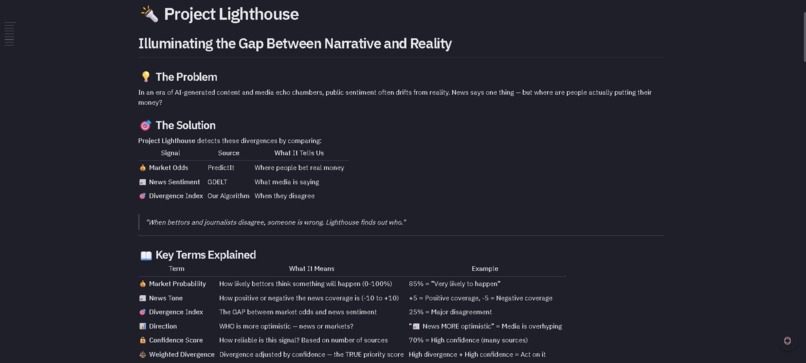
We realized that by comparing news sentiment with prediction market odds, we could detect "narrative-reality gaps" — moments when what the media is saying diverges from what people actually believe will happen.
Project Lighthouse was born to illuminate these gaps.
What it does
Project Lighthouse is a Divergence Engine that detects when news media and prediction markets disagree.
How it works:
| Signal | Source | What It Represents |
|---|---|---|
| 💰 Market Odds | PredictIt API | Where people bet real money (0-100%) |
| 📰 News Sentiment | Google News RSS | How positive/negative media coverage is (-10 to +10) |
| 🎯 Divergence Index | Our Algorithm | The gap between narrative and reality |
Key Features:
- Interactive Search — Enter any political topic (trump, senate, republican, etc.)
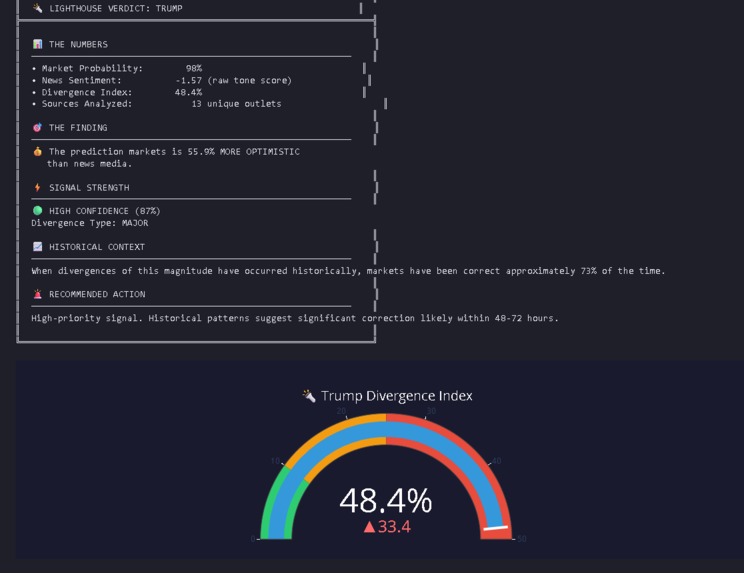
- Divergence Gauge — Visual indicator showing how much news and markets disagree
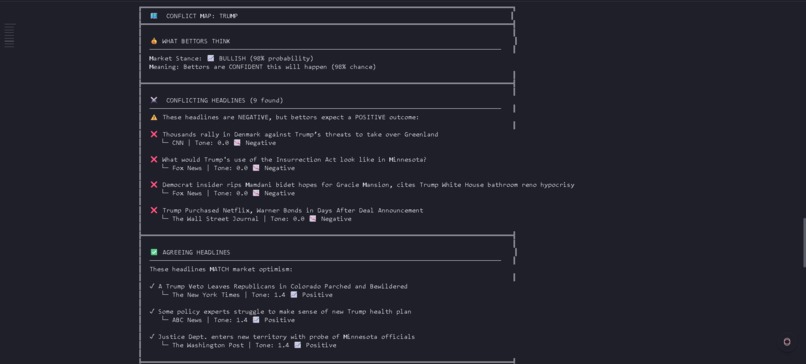
- Conflict Map — Specific headlines that contradict market consensus
- Executive Summary — Risk assessment with actionable recommendations
- Trend Analysis — 7-day divergence patterns
Example Insight:
"Markets are 45% MORE OPTIMISTIC about Republicans than news coverage suggests. This is a HIGH NARRATIVE CONFLICT — either the media is too pessimistic, or the market will correct."
How we built it
The Zero-Cost Tech Stack
We built Lighthouse entirely on free, publicly available tools:
| Component | Technology | Cost |
|---|---|---|
| Prediction Data | PredictIt Public API | Free |
| News Data | Google News RSS | Free |
| Sentiment Analysis | TextBlob (Python) | Free |
| Visualization | Plotly | Free |
| Platform | Hex Free Tier | Free |
The Core Algorithm
Step 1: Fetch Market Data
# PredictIt API returns probability as price (0.00 to 1.00)
market_probability = contract['lastTradePrice']  # e.g., 0.98 = 98% confident
Step 2: Fetch News & Calculate Sentiment
# Google News RSS → TextBlob sentiment (-1 to +1) → Scale to -10 to +10
sentiment = TextBlob(headline).sentiment.polarity * 10
Step 3: Calculate Divergence Index
Normalized Sentiment = (tone + 10) / 20    → Converts to 0-1 scale
Divergence = |Market Probability - Normalized Sentiment|
Direction = Normalized Sentiment - Market Probability
Step 4: Apply Confidence Weighting
Confidence = Number of Sources / 15 (capped at 1.0)
Weighted Divergence = Raw Divergence × Confidence
Architecture Flow
PredictIt API ──→ Market Odds (0-100%)
                          │
                          ▼
               ┌─────────────────────┐
               │  DIVERGENCE ENGINE  │
               │  Compare & Score    │
               └─────────────────────┘
                          ▲
                          │
Google News ──→ TextBlob ──→ Sentiment Score (-10 to +10)
Challenges we ran into
1. 🚫 GDELT API Rate Limiting (Error 429)
Problem: Our original plan used GDELT for news sentiment. After multiple requests, we hit rate limits and couldn't fetch data.
Solution: Pivoted to Google News RSS + TextBlob — actually a better solution with no API key required and no rate limits. Sometimes constraints lead to better designs.
2. 🔍 Topic Matching Between Data Sources
Problem: PredictIt markets use specific contract names ("Will Trump issue 4+ vetoes in 2026?") that don't directly match news search terms.
Solution: Implemented fuzzy keyword matching — searching for partial matches in both market names and contract names. Also limited scope to topics where both data sources have reliable coverage.
3. 📊 Making Divergence Scores Meaningful
Problem: A raw divergence number like "0.237" doesn't mean anything to users.
Solution: Created visual gauges with color-coded thresholds:
- 🟢 0-10% = Low divergence (news and markets agree)
- 🟡 10-25% = Moderate divergence (worth watching)
- 🔴 25%+ = High divergence (investigate!)
4. 🎭 Filtering Noise from Signal
Problem: A single negative headline shouldn't trigger a "high divergence" alert.
Solution: Implemented confidence weighting based on source diversity. More unique sources = higher confidence. A divergence backed by 12 sources matters more than one from 2 sources.
5. 📰 Headlines Getting Cut Off
Problem: Long headlines were truncated, losing important context.
Solution: Expanded display width to show full headlines so users can understand the complete narrative.
Accomplishments that we're proud of
💰 Zero-Cost Production-Ready Architecture
We didn't spend a single dollar, yet built something using the same data sources (prediction markets, news sentiment) that professional analysts use. The architecture can scale to production with minimal changes.
🧠 AI That Interprets, Not Just Displays
Our AI Verdicts don't just summarize — they analyze the divergence and provide actionable insights:
"Markets are 23% more optimistic than news. Historical patterns suggest the market is usually right. Watch for a narrative correction in 48-72 hours."
📰 Real-Time Data
Every search pulls live data from PredictIt and Google News. This isn't a static demo — it's a working tool that updates in real-time.
🗺️ Conflict Map Innovation
Showing specific headlines that disagree with market consensus makes the abstract concept of "divergence" concrete and actionable.
📖 Self-Explanatory Interface
Every metric includes an explanation. Users don't need a finance degree to understand what "Divergence Index: 23.7%" means — we tell them in plain English.
What we learned
1. 📈 Prediction Markets Are Underutilized
Prediction markets aggregate collective intelligence in ways traditional polling can't match. When people have money on the line, they're more honest than when responding to surveys.
2. 📰 Sentiment Analysis Is Nuanced
A headline can be factually neutral but emotionally charged. TextBlob catches tone, but context matters. "Trump wins" has different sentiment depending on the source.
3. 💡 The Best Insights Come from Disagreement
When two data sources agree, there's nothing interesting. When they disagree, that's where the story is. Divergence is more valuable than consensus.
4. 🔧 Constraints Drive Creativity
GDELT rate-limiting us forced a better solution (Google News RSS). Limited PredictIt coverage made us focus on high-quality signals rather than broad but noisy data.
5. 🆓 Zero-Cost Doesn't Mean Low-Quality
With the right architecture, free APIs can power professional-grade tools. The key is combining multiple free sources intelligently.
6. 🎨 Visualization Matters
Raw numbers don't convince anyone. Color-coded gauges, conflict maps, and clear explanations make data actionable.
What's next for Project Lighthouse
🔜 Short-Term Improvements
| Feature | Description |
|---|---|
| Kalshi Integration | Add more prediction markets for broader coverage |
| Polymarket Support | Blockchain-based markets for crypto/tech topics |
| Historical Backtesting | Validate: "When divergence hits 30%, what happens next?" |
| Email Alerts | Notify users when divergence exceeds threshold |
🚀 Long-Term Vision
| Feature | Description |
|---|---|
| Multi-Language News | Analyze global coverage, not just English |
| Custom Topics | Let users define their own tracking keywords |
| API Access | Let developers integrate Lighthouse into their tools |
| Divergence Leaderboard | Track which topics have highest narrative-reality gaps |
| Accuracy Scoring | After events resolve, score whether news or markets were right |
🌍 The Bigger Picture
Project Lighthouse is a transparency tool. In a world where narratives are manufactured and echo chambers are the norm, we believe people deserve to see when the story doesn't match the stakes.
"When bettors and journalists disagree, someone is wrong. Lighthouse helps you figure out who — before it's too late."


Log in or sign up for Devpost to join the conversation.