-

Home Page: Graphical header with map below.
-
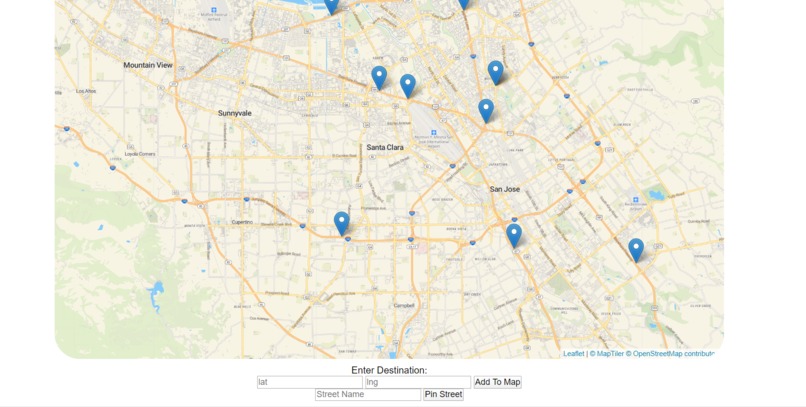
Map with way points of car accident history. Below are boxes to add a destination.
-
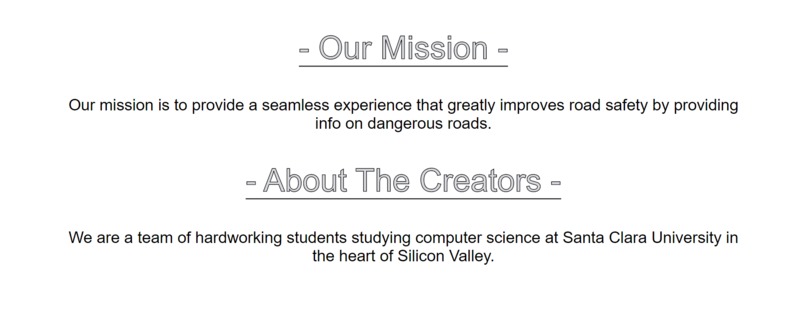
Our mission and about statement, can be found on the about page.


Inspiration
Millions die in preventable car accidents every year, we want to offer visualized data on the safety of roads.
What it does
Uses a database of the history of car accidents and their causes in California to display road incidents.
How I built it
Using Leaflet map API and implementing it into a website application using JavaScript, HTML, CSS, JSON, Node.Js.
Challenges I ran into
Implementing the map API, parsing large amounts of data.
Accomplishments that I'm proud of
Implementing the map API, creating a live website, parsing large amounts of data from different file formats and learning new languages.
What I learned
HTML, CSS, JavaScript Fundamentals, API implementations, team collaboration.
What's next for SafeRides
Using a live feed of car crash data as the input for our program, expanding to the whole United States, rating every road in the United States using a proper rating algorithm.


Log in or sign up for Devpost to join the conversation.