-
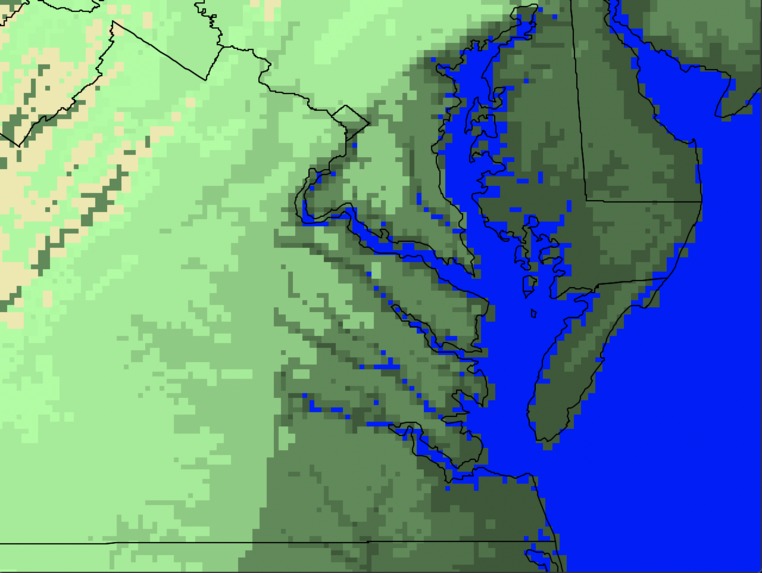
Current heatmap of the Chesapeake bay watershed
-

CSSQ Logo
-
CSSQ Home Page


Inspiration
The effects of climate change have exacerbated weather globally leading to hotter temperatures, more frequent droughts, and the extinction of various species. One significant outcome of these changes is the rise in sea levels which has affected different areas to varying degrees. As climate change continues to reshape the planet there is a possibility that cities located along the coast will become submerged and uninhabitable as the modern day Atlantises of the world.
What it does
The Sea Level Simulator provides us with the world's appearance of what the future may hold and the land that could potentially be lost. The Open Topo Data API was implemented to supply precise elevation levels for the Chesapeake Bay, Potomac River, and Rappahannock River areas to the simulation. It can provide accurate readings because of its usage of latitude and longitude as well as data gathered using a satellite. By utilizing a slider tool users can navigate through time from the years 2023 to 2100 and visually observe the predicted outcomes without needing to interpret any datasets. This structure makes the data scientists work able to be put into perspective for ordinary people instead of being a meaningless blob of data.
How we built it
Frontend: HTML and CSS Backend: Python (Packages: Tkinter, PIL, Request, JSON) Data: Open Topo Data API, Dockers
Challenges we ran into
Because none of us have worked together in a coding environment before, the communication and collaboration learning curve was suddenly very real and very much a challenge. We divided into two groups, front end and back end, and offered advice and feedback on the other side’s code when needed. Once we decided on a topic for our project, our team considered what was necessary to build the simulation. We considered topographic data and the changes in sea levels in the future but ran into some trouble finding reliable sources. At one point, we decided to change our topic entirely. In the end, however, we were able to successfully create the simulation by using the Open Topo Data API. Our team also struggled with incorporating the simulation itself into the website made from HTML.
Accomplishments that we're proud of
We are especially proud of the overall design of our project as well as how the simulation turned out. We had our hardships, but persevered. The final maps will be our greatest achievement as they took the longest to construct and the most ingenuity as well as teamwork.
What we learned
This was most of our team's first hackathon, so we learned a lot, including the fact that drinking caffeine in large quantities for over 24 hours is not a good idea. We also learned about how to customize the front end of a website to make it look polished while incorporating all of the necessary details, and to make heatmaps using topographical data, latitude and longitude, sweat, and tears.


Log in or sign up for Devpost to join the conversation.