-
-
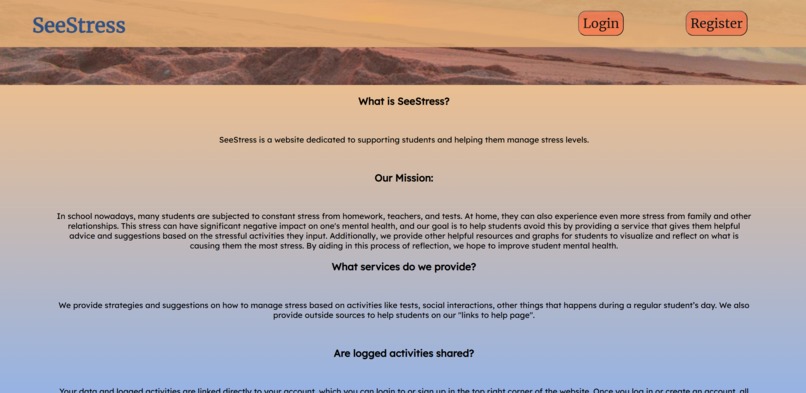
Home Page Bottom
-
Register Page
-
Dashboard Top
-
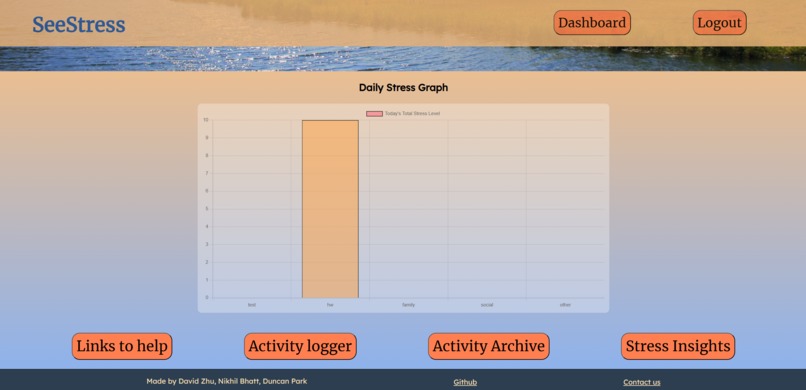
Dashboard Bottom
-
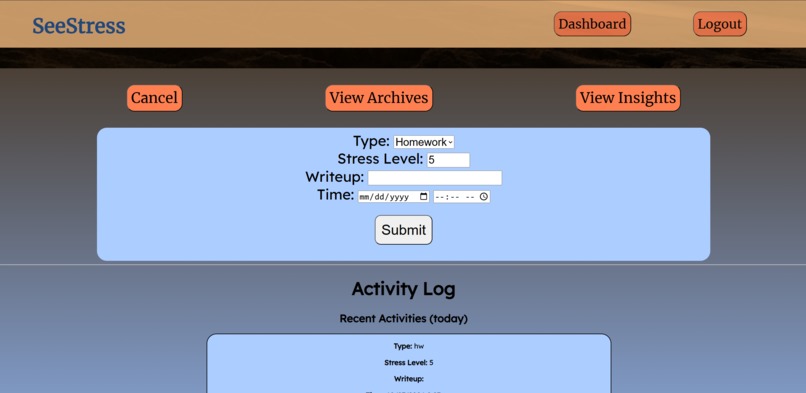
Activity Logger
-
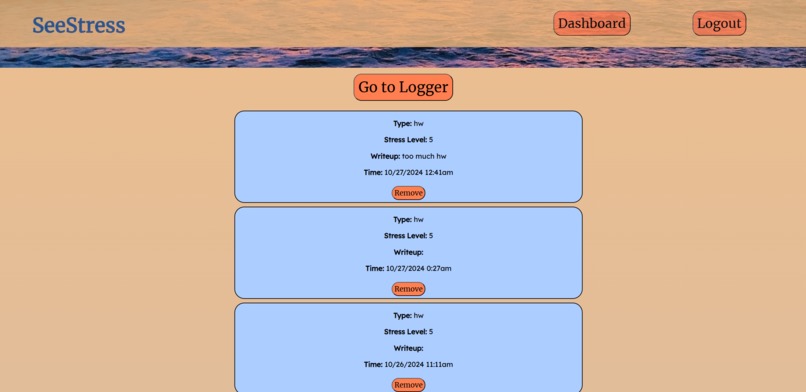
Activity Archive
-
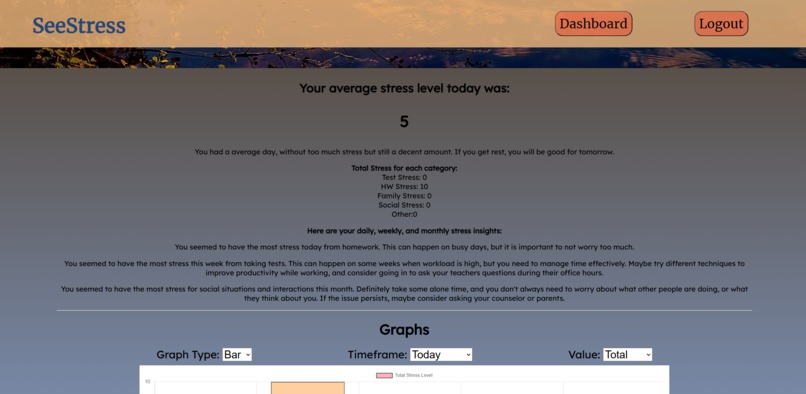
Personalized Insights
-
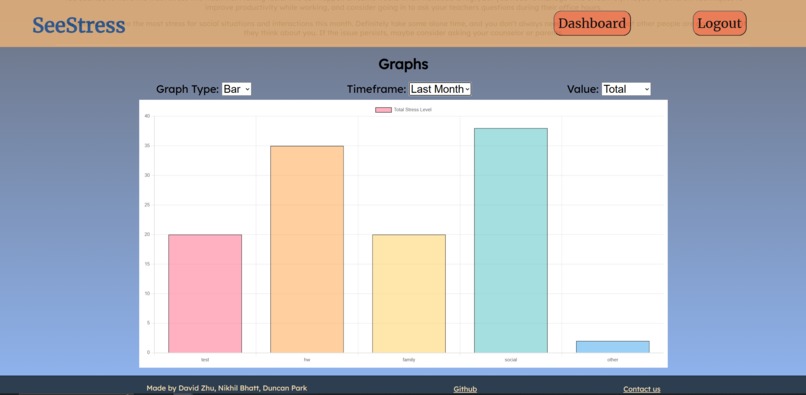
Graph Insights
-
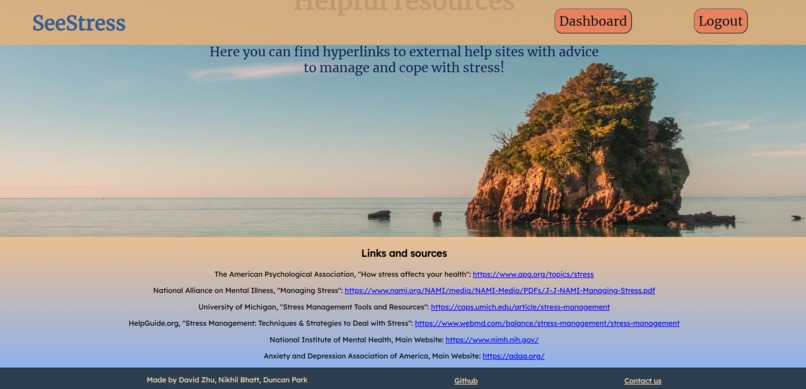
Helpful Links and Resources


Inspiration
We were inspired to make this app after experiencing, and witnessing other peers experience, stress from so many different sources it feels overwhelming. When one has too much to worry about, they are unable to worry about any of them! We hope SeeStress is able to help these people suffering from stress by allowing them to analyze their trends and offering insights.
What it does
SeeStress is an innovative and unique web app that allows users to log and analyze data about their stressful activities. Users can enter log activities, categorize them into common types, and rate them on a stress level from 1-10. Additionally, they can include a write-up about the activity, and its date and time. With this data inputted from the user, SeeStress works its magic! Daily summary graphs are displayed, giving users a quick overview of their daily stress levels. Furthermore, each day, users are shown their day's stress level. Based off previous and current stress data and trends, SeeStress offers personalized and adaptive advice and insights that aim to help the user reflect and act on their different causes of stress. Last but not least, SeeStress includes a visualization tool for users to analyze their data. A graph is displayed that can be configured in many different ways, including a bar graph, a pie chart, or a line graph. Users can analyze data from different timeframes like the day, the last week, the last month, or the last year, and see different data values like the Total or Average Stress Level. Using this graph, they can visually compare types of activities that cause them stress, and analyze trends in the changes of their stress level over time. This allows the user to quantify and reflect on their stresses, instead of just being overwhelmed by them.
Stress is something we all encounter every day. SeeStress visualizes user's every day stress level and allows them to analyze the data and predict which activities make them stressed. Our vision is that this app helps students all over the world visually understand their own stress.
How we built it
This website was created with simple HTML, CSS, and JS. Every web page was designed and coded by us from scratch. However, we used Google's Firebase as the framework for our authentication and server system. Also, we used Chart.js to generate graphs from the data we provided. Github was used to manage version control, and VSCode was our editor of choice. Each webpage was built by first designing it intentionally and effectively on a Google Slides in order to provide a consistent and user-friendly page design.
Challenges we ran into
Working with 3 different people, managing version control was tricky. Luckily, we used Github, which made it much easier. Resolving merge conflicts was sometimes scary, but everything worked out in the end. Additionally, we ran into challenges by trying new things. Each of us had to use new techniques and technologies we hadn't used before to make this project, such as different JS libraries, but we were able to overcome those challenges with some Googling and problem solving. Finally, the time limit was a huge challenge that loomed over us the entire hackathon. We were able to work non-stop for a long time in order to meet the time limit. Because of this, we didn't need to rush anything and were able to ensure every feature is of the highest quality, and we're certain the app has 100% full functionality.
Accomplishments that we're proud of
We're proud of the personalized insights that dynamically changed based off past trends and current stress levels. We're also proud of the graphs that over many different configurations and display the trends and data about stress in a simple but powerful visualization. Most importantly, we're proud that we were able to finish the app with our original vision, and that we were able to learn new things and have fun!
What we learned
We had to challenge ourselves with learning things in order to complete this hackathon. In general, we learned about Web Dev and how to design web pages with HTML and CSS. We also learned how to use new JS libraries to do things like display graphs. We also gained more knowledge on how to deploy and host public websites. Finally, we learned a lot about time management and design principles that helped us to manage the project consistently.
What's next for SeeStress
We hope to provide even more resources to help people suffering from stress, perhaps even integrating SeeStress with devices that can automatically measure a user's stress level, and maybe using AI to generate even more personalized insights.


Log in or sign up for Devpost to join the conversation.