-
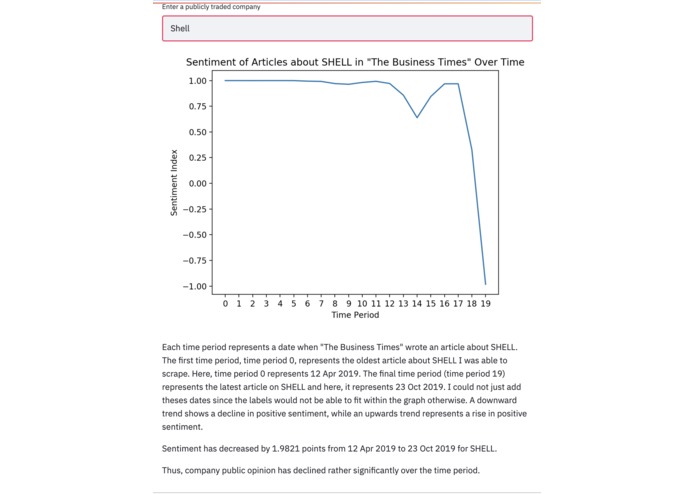
Sample analysis displayed through web application for the oil and gas company Shell

Inspiration
Being able to incorporate the human/psychological aspect of investing in providing investment advice. Numerical analysis is not the only form of analysis of company stocks.
What it does
Conducts exploratory data analysis on the sentiment of a company via a locally hosted web application. Upon entering the name of a company in the application, a graphical visual is displayed, depicting sentiment indices over time of a company calculated based on various "The Business Times" articles on that company. Numerous statements which would allow a user to understand the visual and obtained data insights are also provided.
How I built it
Web scraped a plethora of "The Business Times" articles on a web site using the HTML parsing library BeautifulSoup. Scraped the content of the article and inputed this data into a Sentiment Intensity Analyzer, a part of Python's Natural Language Toolkit. From here, I created visuals of sentiment indices over time using matplotlib. Results were all displayed with a locally hosted web application built with Streamlit.
Challenges I ran into
Numerous websites and articles had restrictions on HTTP requests and making calls to the central API, requiring me to control the rate at which the algorithm scraped for data. Also, there was a tremendous amount of time which went into actually cleaning the necessary data and manipulating it into a form which can be used by the sentiment analyzer.
Accomplishments that I'm proud of
Using web scraping techniques to parse the content of hundreds of articles. Being able to apply a machine learning/NLP model to obtain relevant data, and being able to present this data in an engaging manner (graphical visuals and a web application)
What I learned
Familiarized myself with using HTML parsing to obtain data, used a new framework for web applications (Streamlit), and realized the importance of cleaning datasets and communication in the data analytics and data science fields.
What's next for SentimentalStock
Have SentimentalStock hosted on the Cloud, compare multiple companies in a single graphical display, compare sentiment of companies of articles in The Business Times (used here) with other media companies, and compare correlation between changes in company stock prices with changes in sentiment.
Built With
- beautiful-soup
- matplotlib
- nltk
- python
- streamlit
- vader


Log in or sign up for Devpost to join the conversation.