-
-
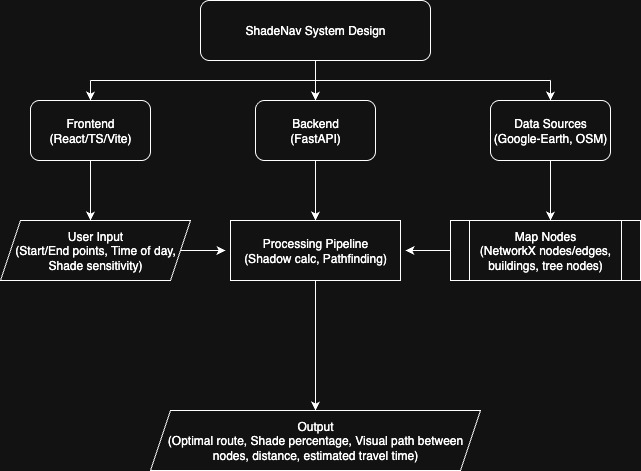
Shadenav system design
-
Website view of shadenav
-
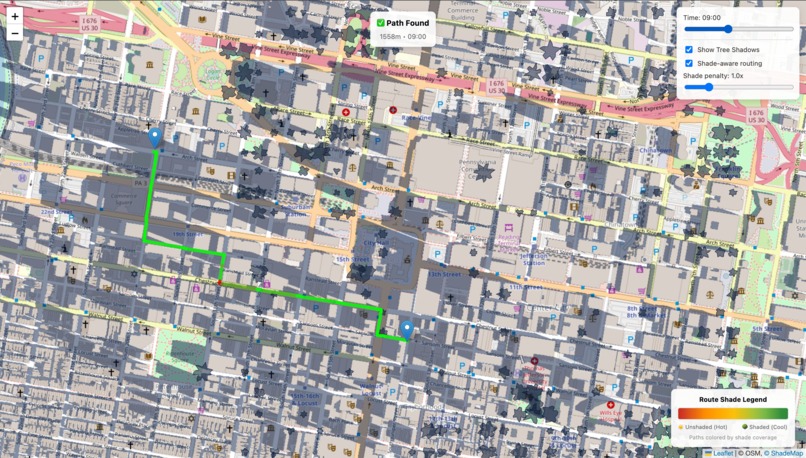
Dynamic pathing illustration: Image illustrating optimal shaded path at 9 am
-
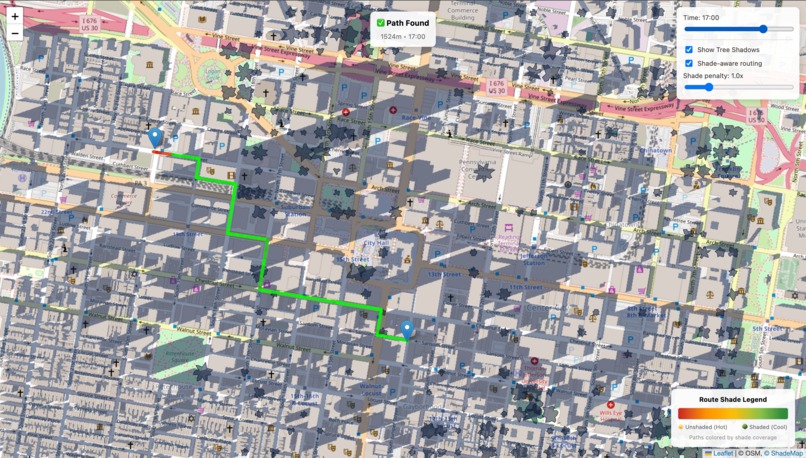
Dynamic pathing illustration: Image illustrating optimal shaded path at 5 pm
-
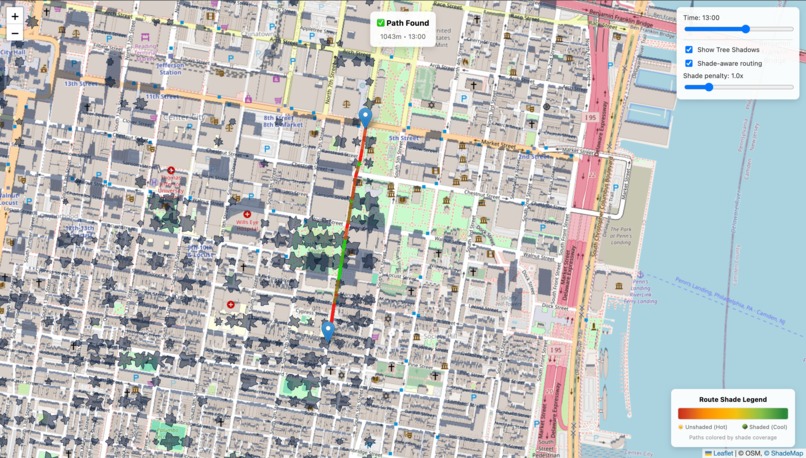
Pathing through tree shadows
-
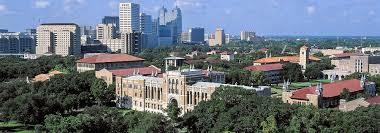
Photo illustrating tree coverage at Rice University


Inspiration
Climate change has created a devastating feedback loop in our cities. Rising global temperatures make walking increasingly unbearable, forcing people to drive more frequently. These additional car trips pump more greenhouse gases into the atmosphere, accelerating climate change and making outdoor temperatures even hotter. It's a vicious cycle that's transforming walkable cities into car-dependent urban heat islands.
Living in Houston while attending Rice University, I experience this problem firsthand. For nearly 8 months of the year, the combination of intense heat, humidity, and urban heat island effects makes walking around the city practically unbearable. Surface temperatures can reach 140°F (60°C) on concrete sidewalks, while the "feels like" temperature often exceeds 110°F (43°C).
Yet something fascinating happens when I step onto Rice's campus. Rice University's campus tells a completely different story. Despite being in the same sweltering Houston climate, the campus remains surprisingly walkable throughout the year. The secret? Trees. Everywhere.
Rice's campus is blanketed with mature oak trees, creating a natural canopy that transforms the walking experience. The university's famous Outer Loop - a 2.9-mile path around campus - is one of Houston's most popular running and walking destinations, used by thousands of students, faculty, and community members daily. Even in the peak of Houston's brutal summer, you'll find joggers and walkers enjoying the shaded path.
This stark contrast between the campus and the surrounding city sparked a realization: shade isn't just nice to have - it's the difference between walkable and unwalkable. If strategic tree placement and shade optimization can make Houston's climate bearable on Rice's campus, why can't we apply this principle to entire cities?
What it does
ShadeNav breaks the climate feedback loop by making walking comfortable again through intelligent shade-optimized routing. Our system combines advanced satellite analysis using NDVI (Normalized Difference Vegetation Index), NDWI (Normalized Difference Water Index), and GNDVI (Green Normalized Difference Vegetation Index) to identify vegetation health, density, and shade-providing potential with ultra-precise 5-meter resolution across entire city blocks. We integrate this with real-time sun positioning calculations that account for time of day, date, and location to predict shadow patterns throughout the day and adapt routes based on when users will be walking.
The app also performs comprehensive building shadow analysis by mapping building heights and orientations to calculate shadow patterns cast by urban structures, combining both natural tree shade and artificial building shade sources. Our smart route optimization engine integrates OpenStreetMap data with satellite imagery to find paths that maximize shade coverage while balancing optimization with route efficiency, including strategic waypoints for water fountains and convenience stores. The science behind our approach is compelling: shaded areas can feel up to 20°F (11°C) cooler than direct sunlight during summer months, with surface temperatures running 20-40°F cooler than sun-exposed surfaces.
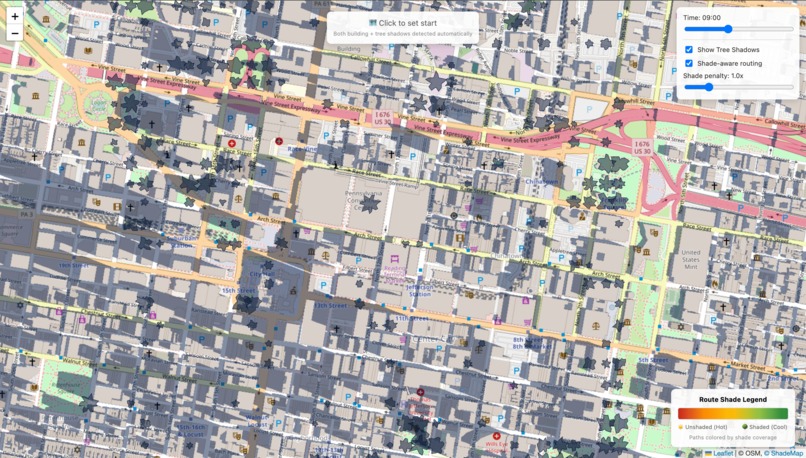
The map below shows shade coverage statistics across downtown Philadelphia, illustrating how our system quantifies and visualizes walkability based on tree and building shade.
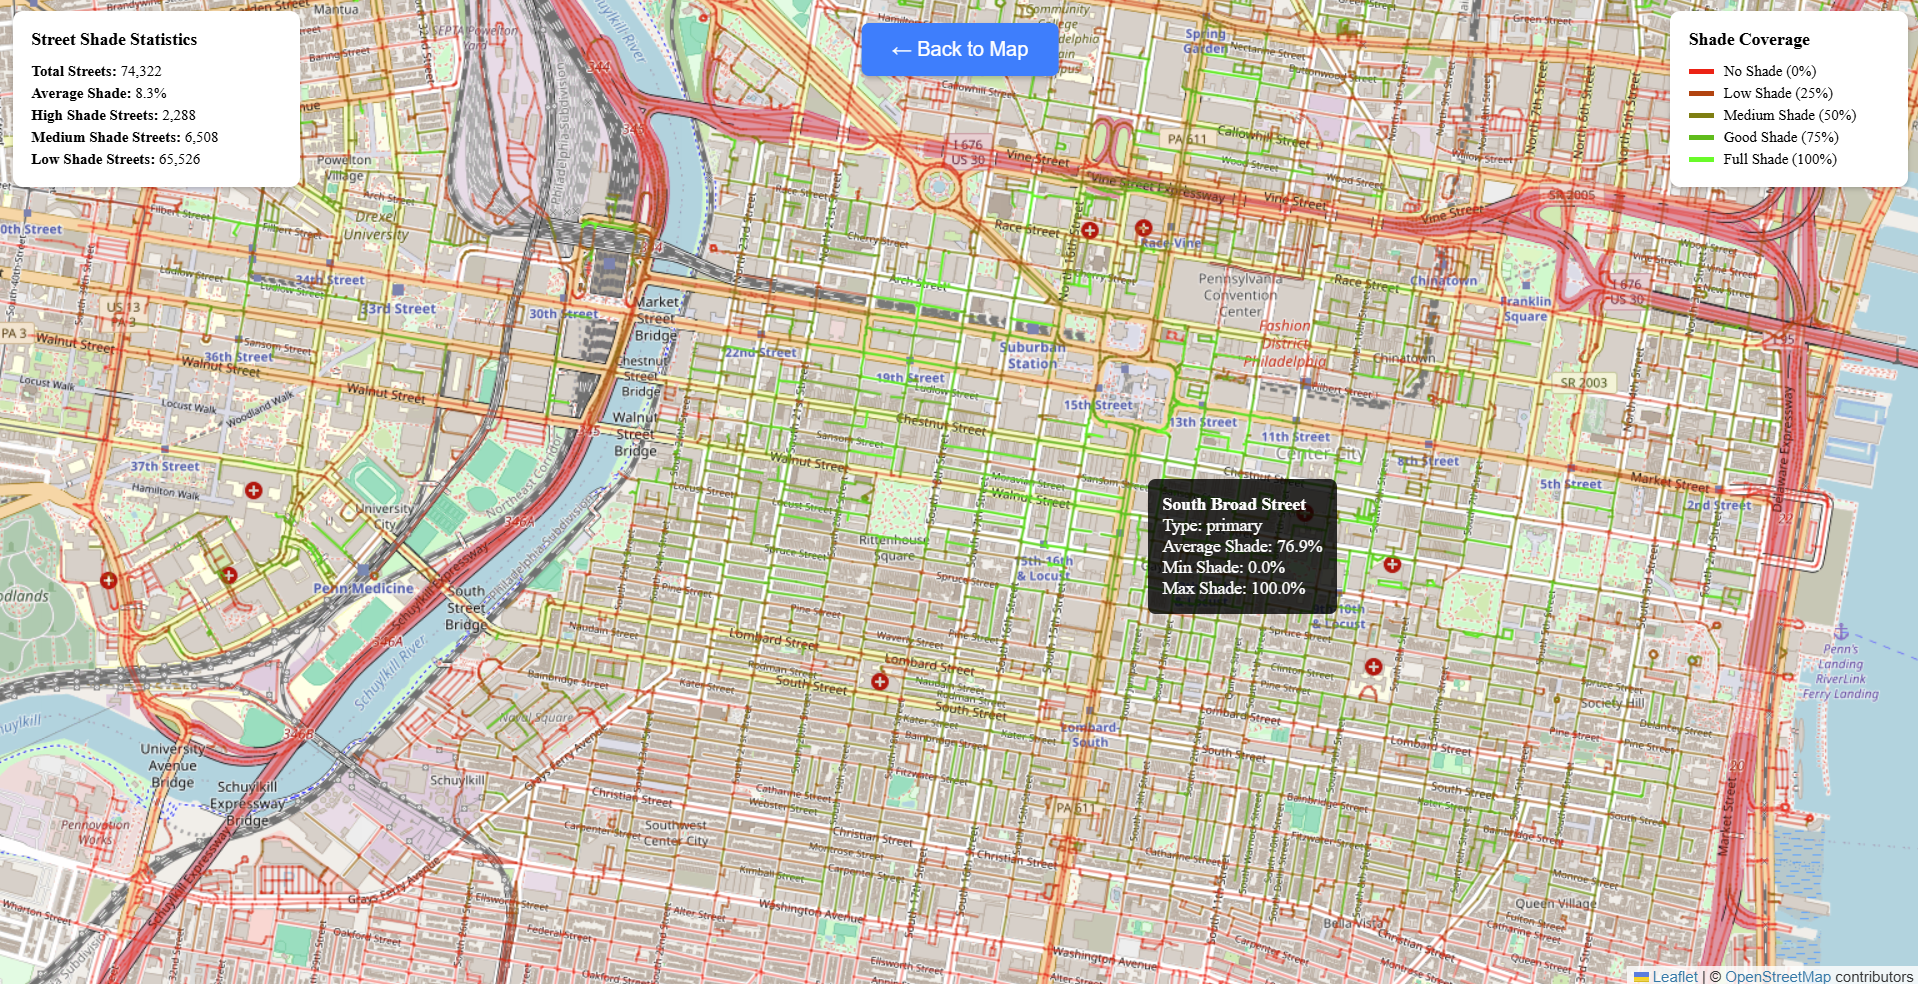
Beyond individual routing, our system can also operate at the city-planning scale. By aggregating shade statistics across neighborhoods and overlaying them on the street network, we can identify “shade deserts” and critical choke points where a lack of shade makes entire areas less walkable. Using network centrality measures such as PageRank or betweenness centrality, we can highlight which streets disproportionately affect overall walkability and should be prioritized for tree planting or shade interventions.
How we built it
We built ShadeNav as a full-stack application with a frontend developed using Vite + React + TypeScript, featuring an interactive Leaflet map component that visualizes shade-optimized routes, tree coverage, and real-time shadow patterns. The backend was developed using FastAPI with a comprehensive data processing pipeline that includes Python scripts using Google Earth Engine API for satellite imagery analysis, combined with OpenStreetMap data processing via OSMnx. We implemented NetworkX for route optimization with custom Dijkstra's algorithm modifications, and used GeoPandas and Folium for spatial data manipulation and visualization, along with custom algorithms for sun angle calculations and building shadow projection.
Our data pipeline processes satellite imagery through Google Earth Engine, extracts and processes OpenStreetMap data, performs graph segmentation and optimization for real-time pathfinding, and serializes everything into JSON format for frontend consumption. The entire system integrates multiple complex data sources to provide seamless, real-time shade-optimized routing.
Challenges we ran into
The technical challenges we faced were substantial and multifaceted. Implementing accurate shadow calculations proved incredibly complex as we had to account for sun angles, building heights, tree canopy density, and time-of-day variations, requiring multiple iterations to get the mathematical models right for shadow projection. Extracting accurate building height data was a major hurdle since OpenStreetMap data is inconsistent for building heights, forcing us to develop fallback methods using building footprints and estimated floor counts. Visualizing dynamic shadows on the map in real-time was technically challenging, requiring experimentation with different rendering approaches while optimizing for performance and maintaining accuracy.
Our biggest nightmare came when we generated a 5GB JSON file containing detailed polygon data for every building and tree shadow in downtown Philadelphia. When we tried to render this data, it literally made our laptops run so hot they were burning to the touch, forcing us to completely rethink our data structure and implement efficient data segmentation and lazy loading. The initial implementation was too slow for real-time use, requiring us to optimize our graph processing, implement caching mechanisms, and segment our data to make the app responsive for actual users.
Accomplishments that we're proud of
We successfully identified and mapped 703 trees in downtown Philadelphia using satellite analysis, achieving dynamic shadow calculation and visualization based on current sun position for real-time shadow mapping. Our team accomplished seamless integration of multiple complex data sources including satellite imagery, OpenStreetMap, and building data into a unified routing system that provides accurate, shade-optimized pathfinding.
Perhaps most importantly, we overcame the massive 5GB data rendering challenge and achieved smooth, responsive mapping performance, transforming what initially crashed our systems into a functional, user-friendly application. Beyond the technical achievements, we created a practical solution that could genuinely reduce urban car dependency and emissions, demonstrating that innovative technology can address real climate challenges while improving daily urban experiences.
What we learned
This project was a massive learning experience for our entire team. None of us had ever touched a mapping API before, so we basically had to learn everything from scratch - Leaflet, OpenStreetMap integration, how geospatial coordinate systems actually work, and how to render maps without everything breaking. We found ourselves diving deep into graph theory to modify Dijkstra's algorithm, which has been around forever, to somehow account for shade weights, time-dependent shadow patterns, and the tricky balance between finding the shortest route versus the shadiest route.
Working with Google Earth Engine was like drinking from a fire hose - we had to wrap our heads around remote sensing, vegetation indices, and processing geospatial data at a scale we'd never imagined. The performance engineering side was brutal too, especially after that 5GB JSON disaster taught us the hard way about data compression, lazy loading, and memory management. By the end, we'd essentially built a full-stack geospatial application, figuring out how to make complex backend processing talk nicely with a responsive frontend that could actually handle real-time mapping without melting our computers.
What's next for ShadeNav
Expanded City Coverage: Scale beyond Philadelphia to major heat-affected cities like Phoenix, Miami, and Austin.
Machine Learning Integration: Implement predictive models for tree growth, seasonal shade variations, and crowd-sourced shade quality ratings.
Community Features: Allow users to report new shade sources, rate route comfort, and contribute to the shade database.
City Partnership Program: Work with urban planning departments to provide data insights for strategic tree planting and urban heat island mitigation.
Mobile App Development: Create native iOS and Android apps with offline routing capabilities and push notifications for optimal walking times.
Climate Adaptation Tool: Expand into a comprehensive urban heat adaptation platform, helping cities plan for increasing temperatures through data-driven shade optimization.
Built With
- fastapi
- folium
- geopandas
- google-earth
- leaflet.js
- networkx
- numpy
- openstreetmap
- python
- react
- shademap
- typescript


Log in or sign up for Devpost to join the conversation.